View By Selector
| View by | Groups metrics by | When to use |
|---|---|---|
| Cache | Cache type (default) | Overall cache performance |
| Virtual Accounts | Virtual account | Compare cache effectiveness across applications |
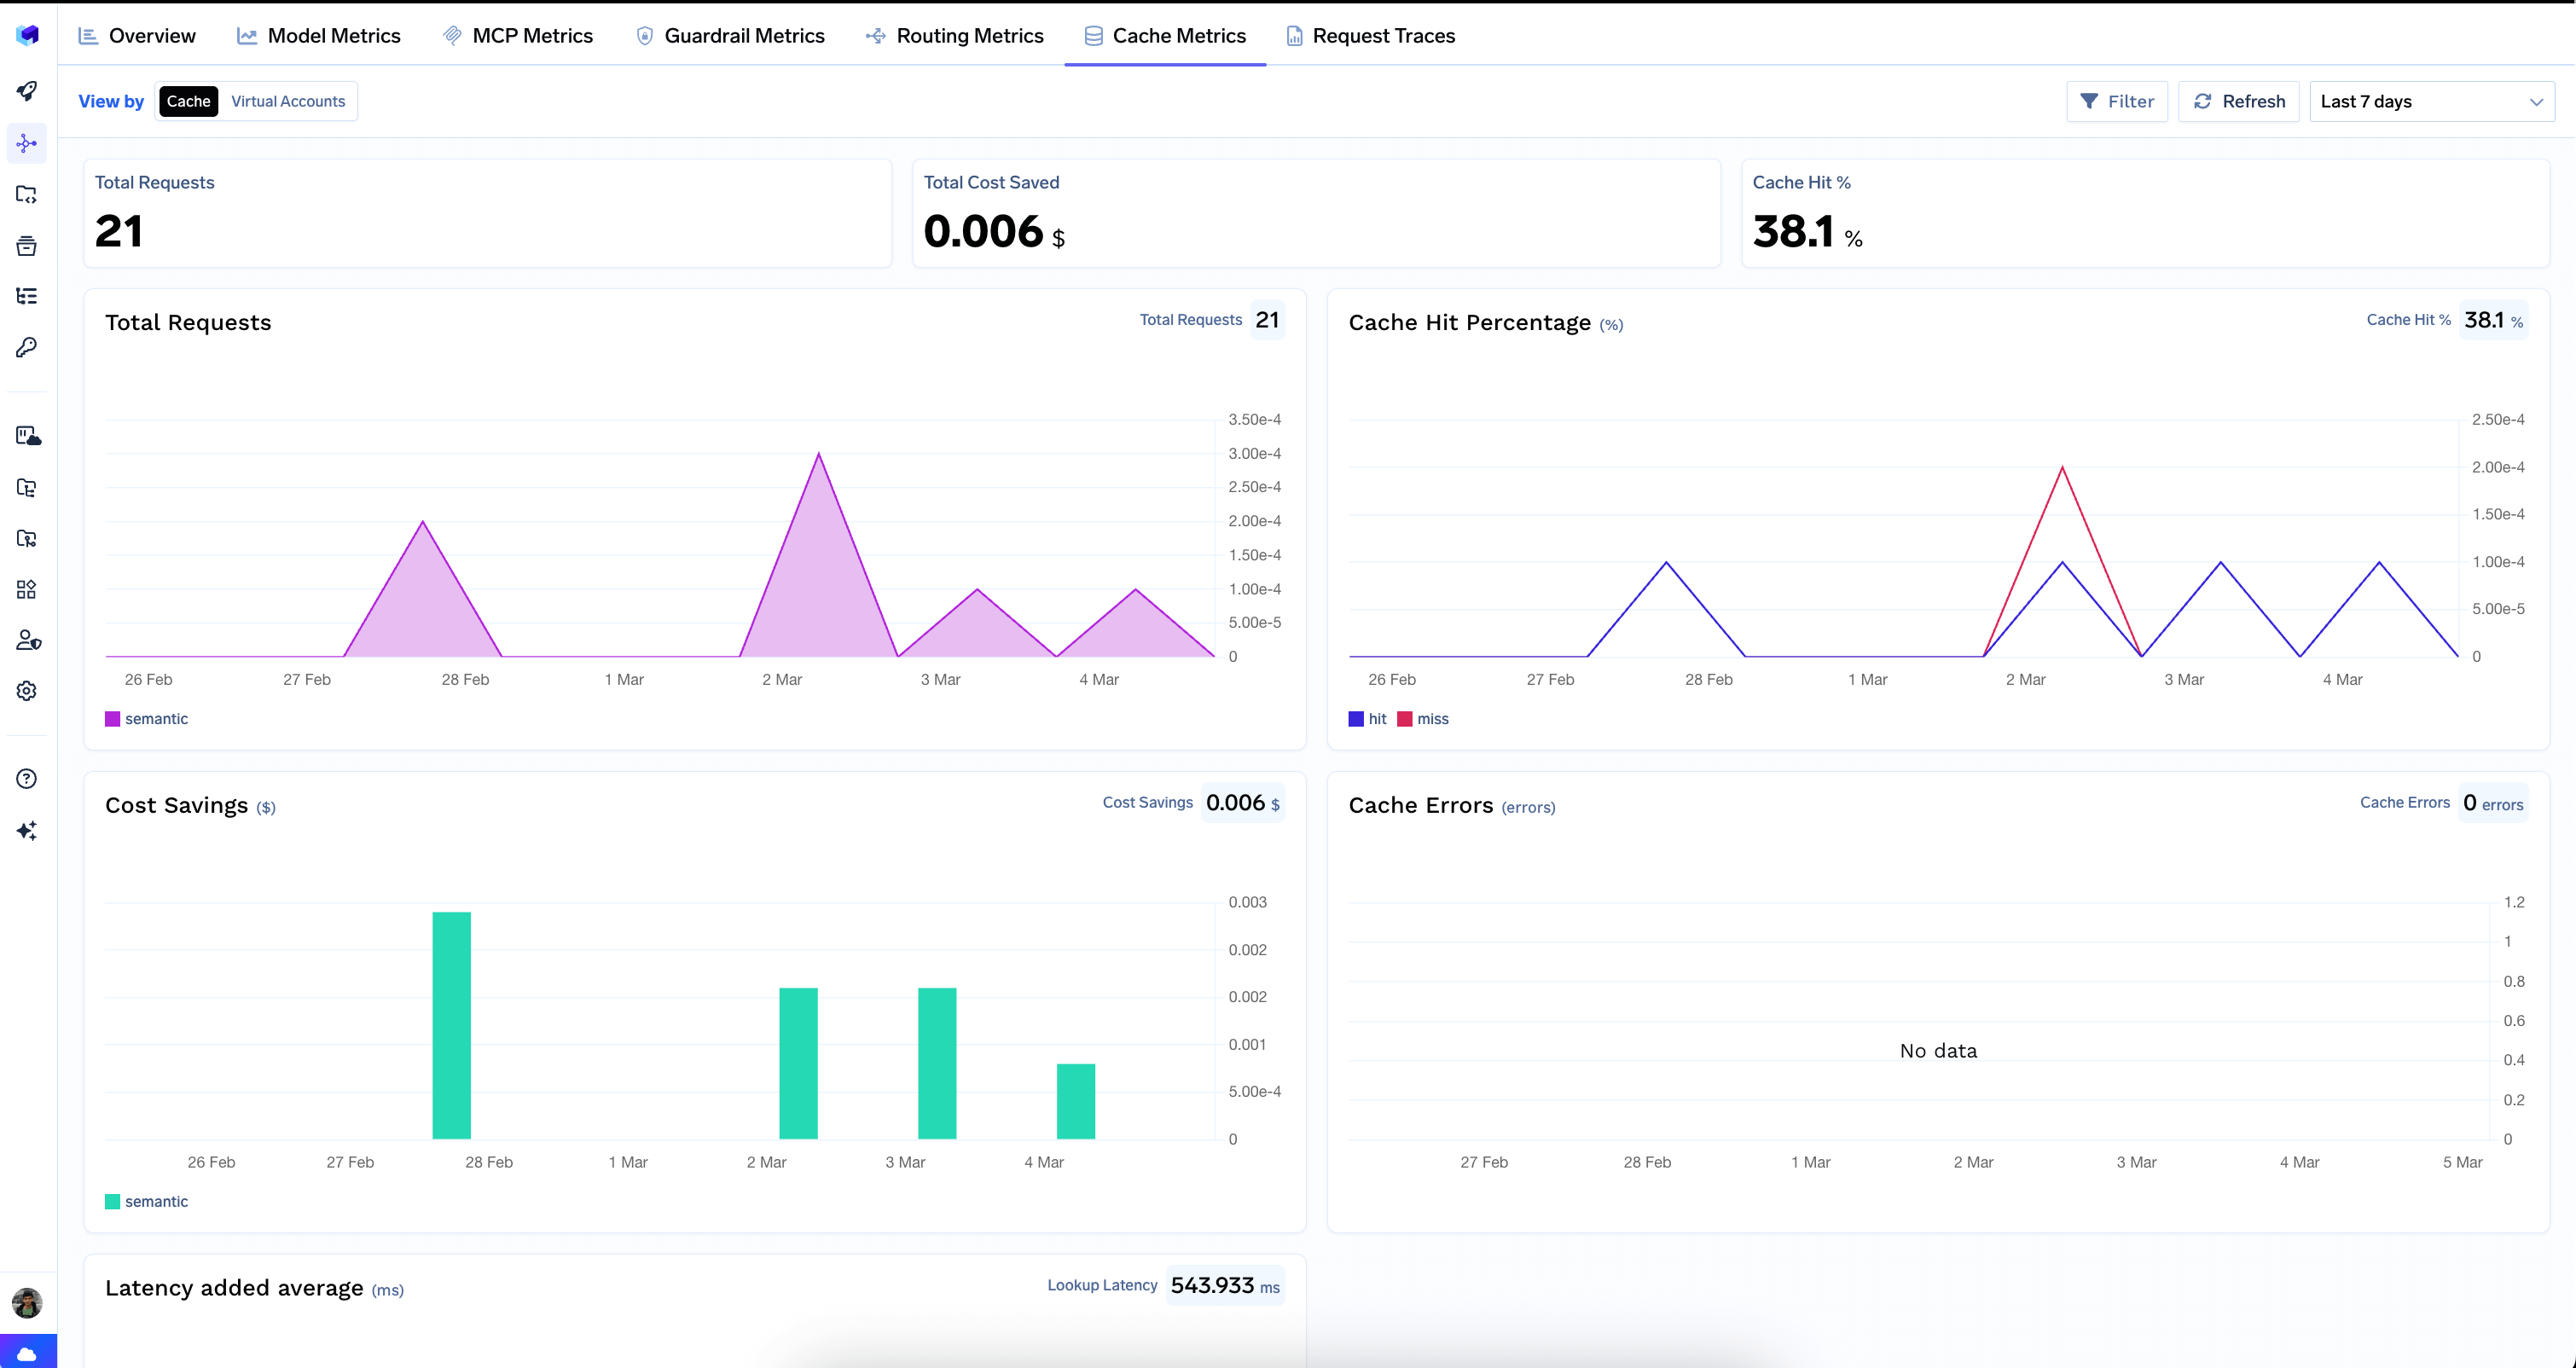
Top-Level Counters
Three headline metrics summarize cache performance:- Total Requests — number of requests that went through the cache lookup.
- Total Cost Saved — dollar amount saved by serving responses from cache instead of calling the model.
- Cache Hit % — percentage of requests served from cache. A higher hit rate means more savings and lower latency for end users.
Charts
Total Requests
Cache request volume over time. This shows you how much traffic is subject to cache lookups and whether cache usage is growing.Cache Hit Percentage
The hit vs. miss rate over time, displayed as a line chart. This is the most important chart for evaluating cache effectiveness:- A high hit rate means the cache is working well — many requests are being served from cache.
- A low or declining hit rate may indicate that your queries are too diverse for the current cache configuration, or that the similarity threshold needs tuning.
Cost Savings
Dollar savings from cache hits over time, displayed as a bar chart. This directly shows the financial ROI of your cache. Use this to justify cache infrastructure costs or to make the case for expanding cache coverage.Cache Errors
Any errors encountered during cache operations (lookups or stores). Ideally this should show “No data” — any errors here indicate issues with the cache infrastructure that need investigation.Latency Added Average
The average latency overhead introduced by cache lookups. Every request that goes through the cache incurs a lookup cost, even on a cache miss. This chart helps you ensure that the latency overhead is acceptable:- A few hundred milliseconds of lookup latency is typical for semantic caches.
- If latency is too high, it may negate the performance benefits of cache hits.
Common Use Cases
- Measure cache ROI: Compare the Total Cost Saved against your cache infrastructure costs to determine whether caching is cost-effective.
- Optimize cache configuration: If the hit rate is low, consider adjusting the semantic similarity threshold, expanding the cache TTL, or caching responses for specific high-traffic queries.
- Monitor cache health: Check Cache Errors regularly to ensure the cache infrastructure is healthy. Any persistent errors should be investigated.
- Evaluate latency trade-offs: Use the Latency Added Average chart to ensure the cache lookup overhead is acceptable for your latency requirements. If cache hit rates are low and latency is high, caching may not be beneficial for your workload.