/metrics, labels, and the full metric catalog on self-hosted gateways, see Prometheus & Grafana integration.
We have built integrations with many observability partners — see the full list here.
Tracing
The OTEL Traces Exporter sends only trace data to your OTEL platform, not metrics. For OpenTelemetry metrics export, see Metrics below.
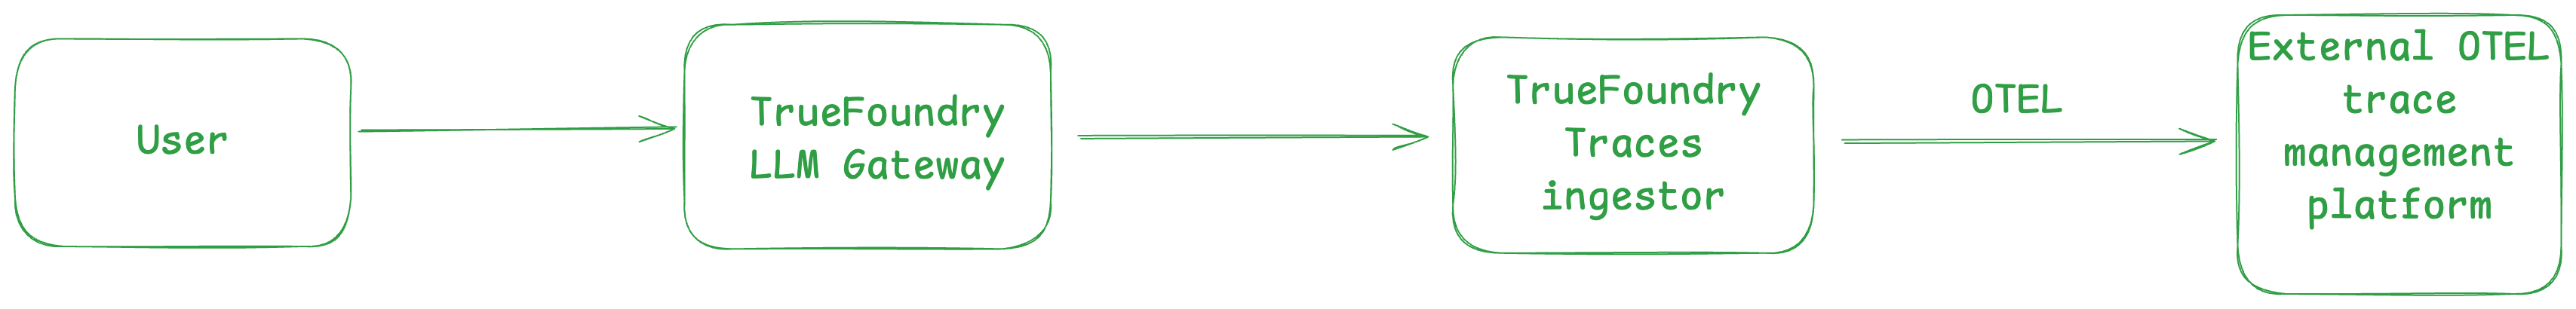
AI Gateway - OpenTelemetry Tracing Flow
Export Traces to OTEL Compatible Observability Platforms
To export spans to your existing OTEL Platform: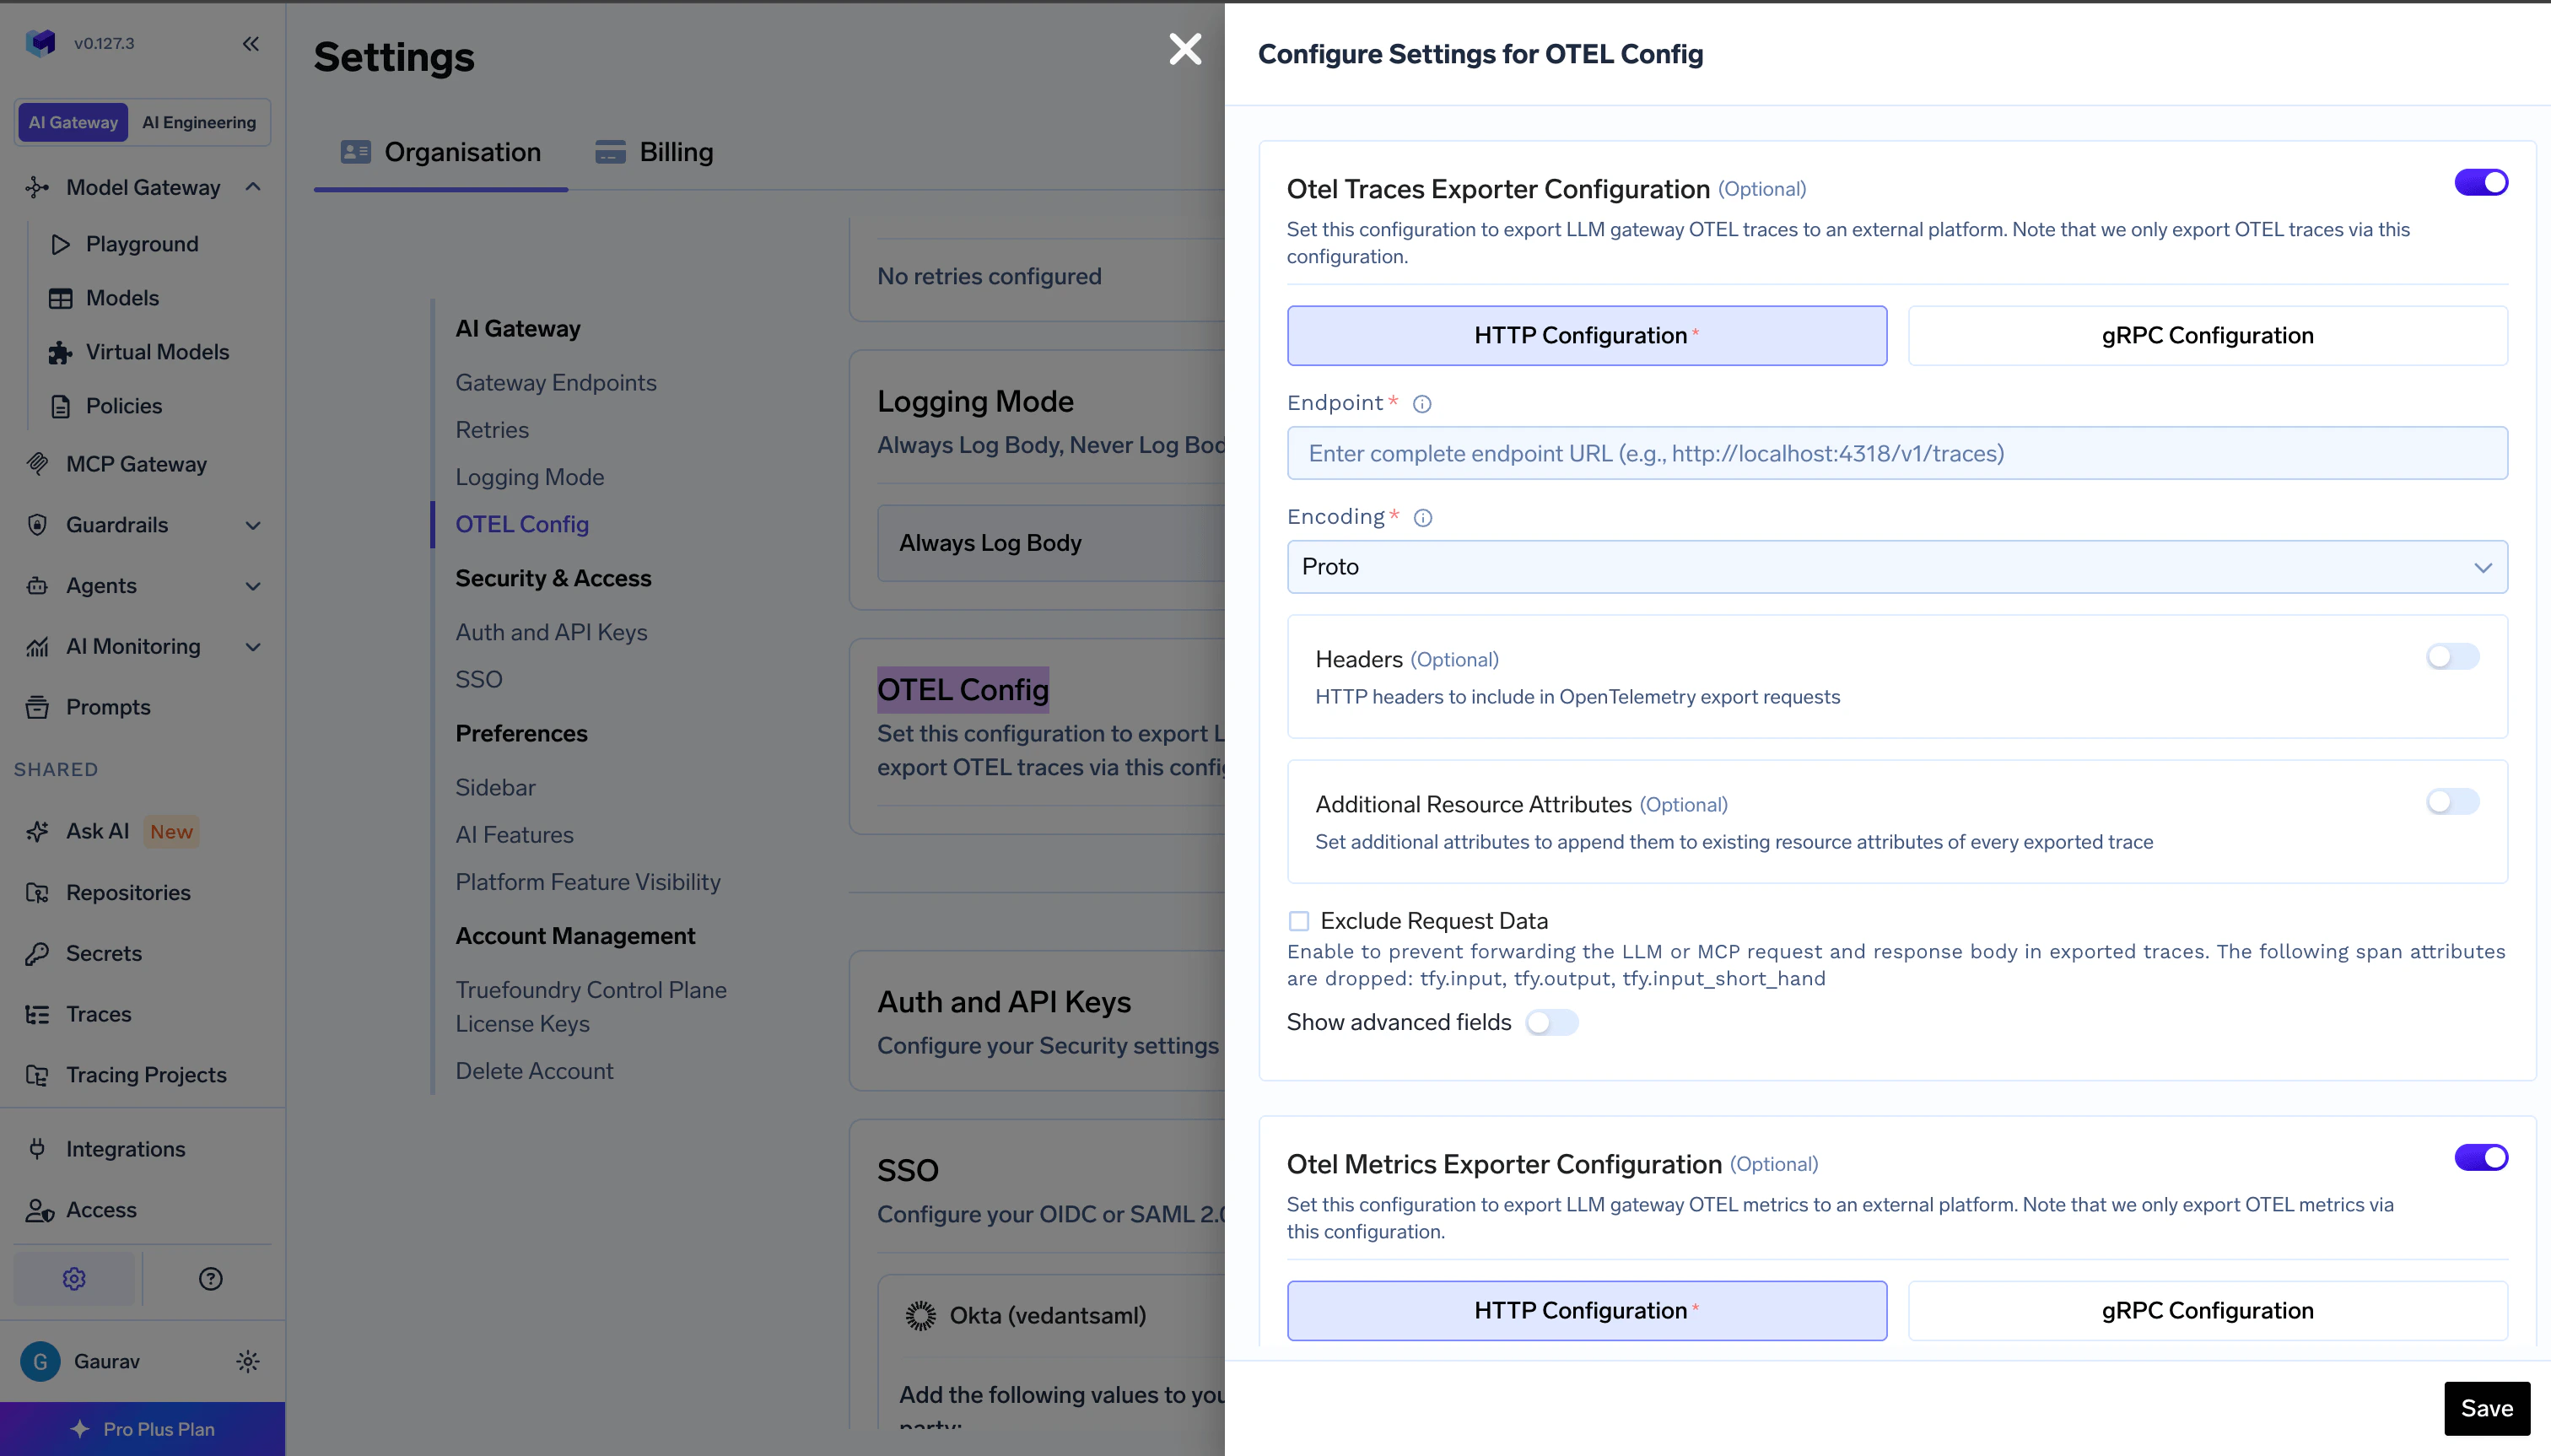
AI Gateway - OpenTelemetry Tracing Export Config Form
- Go to AI Gateway → Controls → Settings in the TrueFoundry dashboard
- Scroll down to the OTEL Config section and click the edit button
- Enable the OTEL Traces Exporter Configuration toggle
- Select either HTTP Configuration or gRPC Configuration based on your OTEL platform’s endpoint
- Enter the complete traces endpoint for eg., the traces endpoint for Grafana Cloud is
https://otlp-gateway-prod-ap-south-1.grafana.net/otlp/v1/traces - Select the encoding (only for HTTP Configuration) as either
protoorjson - Optionally, enter the headers required to export spans to the OTEL provider for eg., authorization, region, etc..
For gRPC endpoints, always include the scheme. Use
http:// for plaintext (e.g., http://otel-collector:4317). If omitted, TLS is used by default.Metrics
The OTEL Metrics Exporter sends only metrics to your OTEL platform, not traces. For OpenTelemetry traces export, see Tracing above.
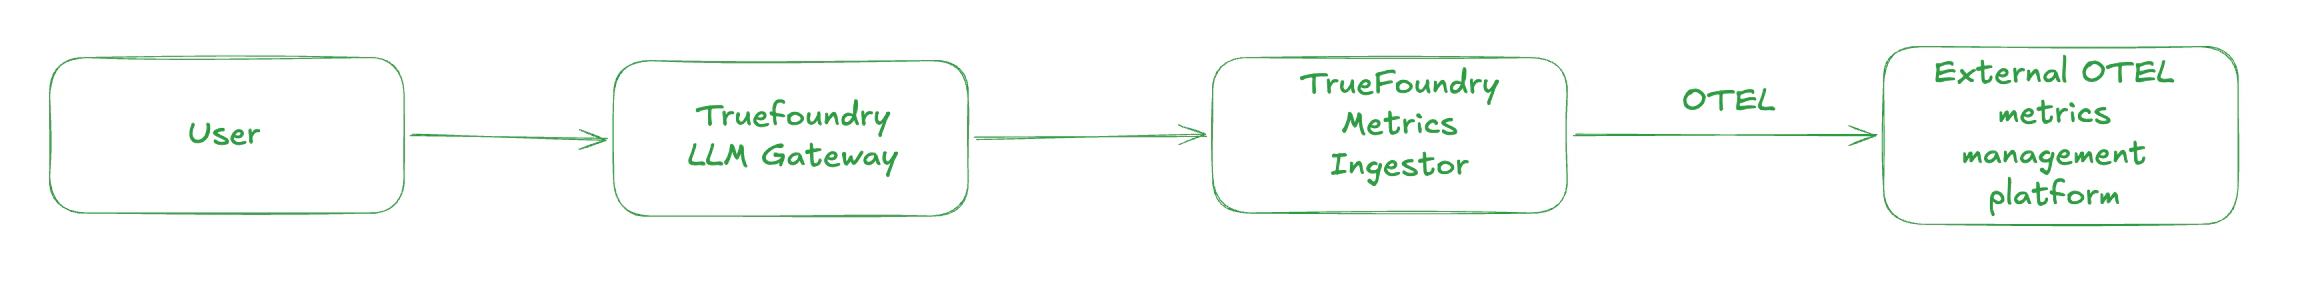
AI Gateway - OpenTelemetry Metrics Flow
Export Metrics to OTEL Compatible Observability Platforms
To export metrics to your existing OTEL platform: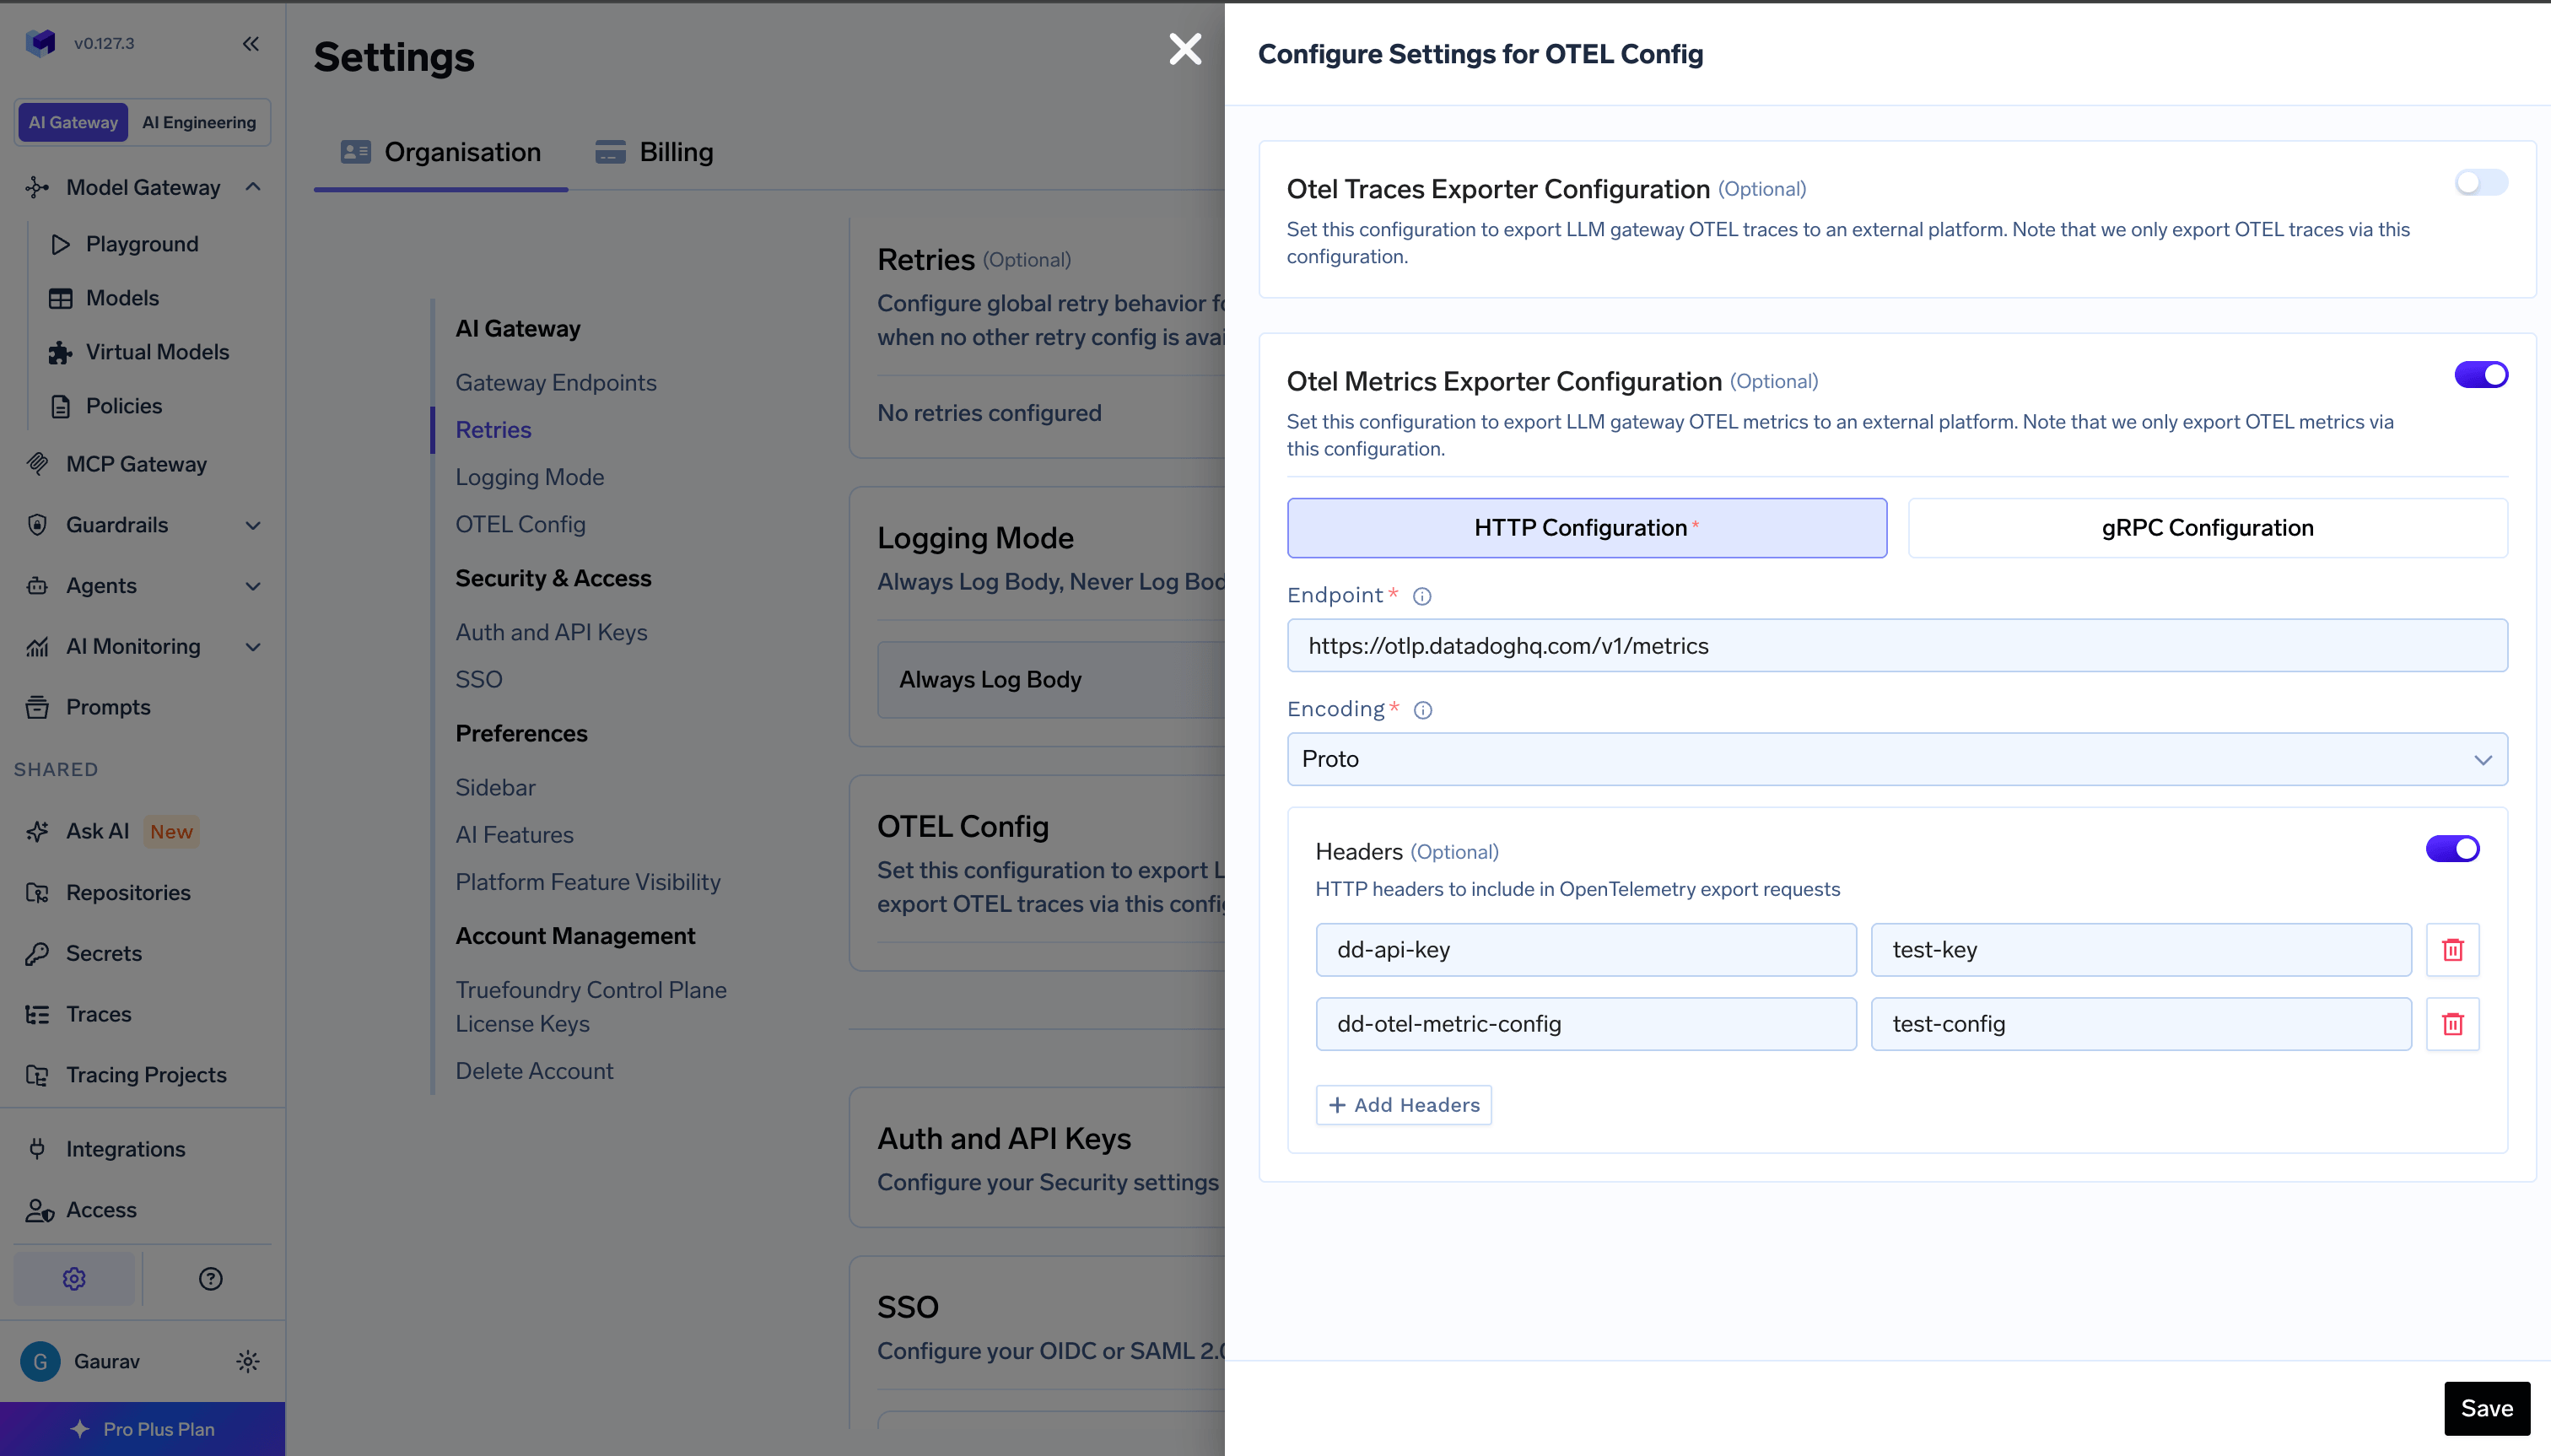
AI Gateway - OpenTelemetry Metrics Export Config Form
- Go to AI Gateway → Controls → Settings in the TrueFoundry dashboard
- Scroll down to the OTEL Config section and click the edit button
- Enable the OTEL Metrics Exporter Configuration toggle
- Select either HTTP Configuration or gRPC Configuration based on your OTEL platform’s metrics endpoint
- Enter the complete metrics endpoint—for example, Datadog uses
https://otlp.datadoghq.com/v1/metrics - Select the encoding (only for HTTP Configuration) as either
protoorjson - Optionally, enter the headers required to export metrics to the OTEL provider—for example, API keys or vendor-specific headers
- Click Save
For gRPC endpoints, always include the scheme. Use
http:// for plaintext (e.g., http://otel-collector:4317). If omitted, TLS is used by default.Example 1: Exporting Metrics to Datadog
Datadog supports OTLP metrics ingest natively. Use the following configuration: Step 1 — Set the environment variable on yourtfy-llm-gateway deployment
Datadog’s OTLP ingest endpoint only accepts delta-encoded metrics. Set this environment variable in your tfy-llm-gateway deployment before configuring the exporter:
Add the following headers:
The
dd-otel-metric-config header enables the histogram translator, which converts OTLP histogram metrics into Datadog distribution metrics. This is required to query percentile aggregations such as p50:ai_gateway_request_processing_ms{*}, p95:ai_gateway_request_processing_ms{*}, and similar metrics in the Datadog Metrics Explorer.
For sites other than US1, use the region-specific endpoint—for example,
https://otlp.datadoghq.eu/v1/metrics for the EU site. See the Datadog OTLP metrics ingest documentation for the full list of endpoints and additional dd-otel-metric-config options.Example 2: Exporting Metrics to AWS Cloudwatch
AWS Cloudwatch supports OTLP metrics ingest. Use the following configuration: Step 1 - Set the environment variable on yourtfy-llm-gateway deployment
Cloudwatch’s OTLP ingest endpoint only accepts delta-encoded metrics. Set this environment variable in your tfy-llm-gateway deployment before configuring the exporter:
OTEL
Delta metric temporality does not export Gauges and UpDownCounters. Any metrics of these types might not be sent with Delta temporality.For scraping
/metrics with Prometheus, OTLP endpoint patterns, and a full list of metric names and labels, see Prometheus & Grafana integration.