

Setup
The AI Gateway exposes a/metrics endpoint that can be scraped by your Prometheus instance. This is the standard way to collect metrics.
Alternatively, if your setup uses an OpenTelemetry Collector, you can configure the AI Gateway to push metrics directly. To do this, set the following environment variables for the tfy-llm-gateway service:
ENABLE_OTEL_METRICS: Set to"true".OTEL_EXPORTER_OTLP_METRICS_ENDPOINT: The endpoint of your OTEL metrics exporter.OTEL_EXPORTER_OTLP_METRICS_HEADERS: (Optional) Headers for authentication.
Example Push Configuration
Labels
Labels provide dimensions for filtering and aggregating metrics.Gateway Metrics
These metrics provide an overview of the AI Gateway’s performance and usage.Request Count
A client that disconnects mid-stream increments
ai_gateway_gateway_http_status with status_code="499" and error_origin_level="client_disconnected". Cost may still be attributed, depending on the provider. See Cancelled and disconnected streams.Token Usage and Cost
Latency
Errors and Failures
error_code on this metric is the HTTP status (for example 403). A missing model and a genuine ACL denial both increment this counter with error_code="403". To tell them apart, filter traces on tfy.error_type: tfy-model-not-found vs tfy-forbidden. See Authorization vs missing model.Configuration Metrics
Rate Limiting
Budget
Load Balancing
Guardrails
Grafana Integration
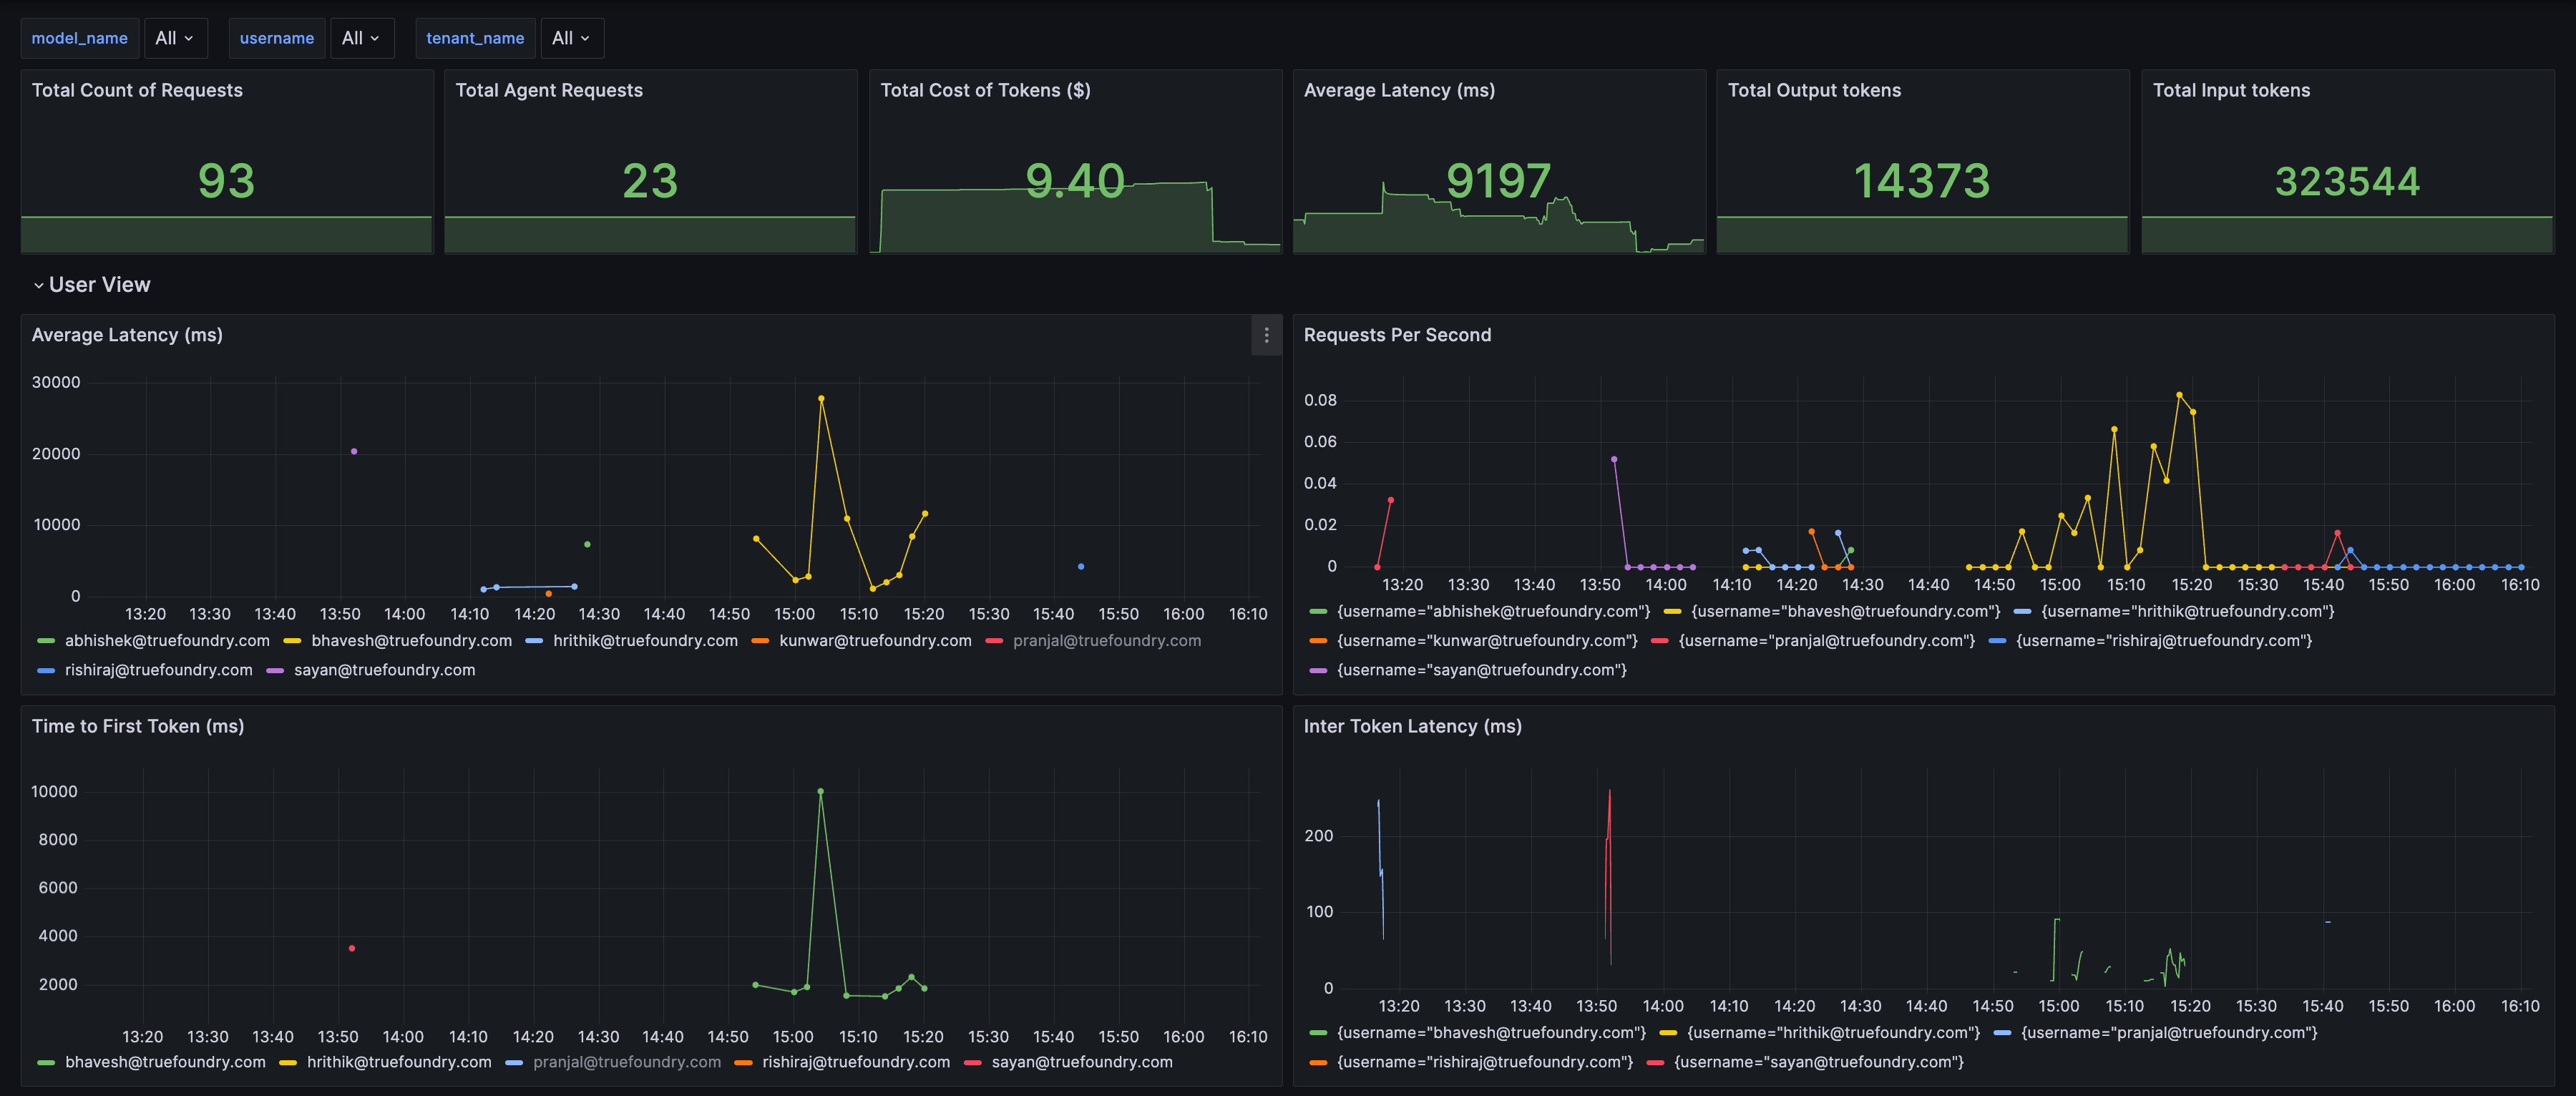
Our pre-built Grafana dashboard helps you monitor the LLM Gateway. It is organized into several views so you can analyze gateway activity from different perspectives.Note
You can find the Grafana Dashboard JSON at the following link:
https://github.com/truefoundry/infra-charts/blob/main/charts/tfy-grafana/dashboards/llm-gateway-metrics.json
Dashboard Views
Our pre-built Grafana dashboard is organized into several views to help you analyze gateway activity from different perspectives:- Model View: Groups metrics by
model_nameto compare model performance. - User View: Groups metrics by
usernameto monitor usage patterns. - Config View: Groups metrics by
ruleIdto show the impact of gateway configurations.
Importing the Dashboard
- Copy the JSON dashboard definition below.
- In your Grafana instance, navigate to Dashboards > Import.
- Paste the JSON into the Import via panel json text area.
- Click Load.
- On the next screen, select your Prometheus data source.
- Click Import.
Customizing the Dashboard
The pre-built dashboard includes filters formodel_name, tenant_name, and username. If you use custom metadata labels (via LLM_GATEWAY_METADATA_LOGGING_KEYS), you can add them as filters to your dashboard for more granular analysis.
Add a Dashboard Variable
For example, to filter by a custom metadata key likecustomer_id, add a new variable to your dashboard settings:
- Go to Dashboard settings > Variables.
- Click New variable.
- Configure the variable as follows:
- Name:
customer_id - Type:
Query - Label:
Customer ID - Data source: Your Prometheus source
- Query:
label_values(ai_gateway_input_tokens_total, ai_gateway_metadata_customer_id) - Multi-value: Enabled
- Include All option: Enabled
- Name:
Use the Variable in Queries
Update your panel queries to use the new variable. For example, to filter input tokens bycustomer_id: