To log data from your job runs, you need access to an ML Repository (MLRepo). ML Repositories store models, data, artifacts, and prompts and are backed by blob storage like S3, GCS, or Azure Blob Storage.
A run is used to represent a single ML experiment. You can create a run at the beginning of your script or notebook, log parameters, metrics, artifacts, models, tags and finally end the run. This provides an easy to keep track of all data related to ML experiments.A quick code snippet to create a run and end it:
from truefoundry.ml import get_clientclient = get_client()run = client.create_run(ml_repo="iris-demo", run_name="svm-model")# Your code here.run.end()
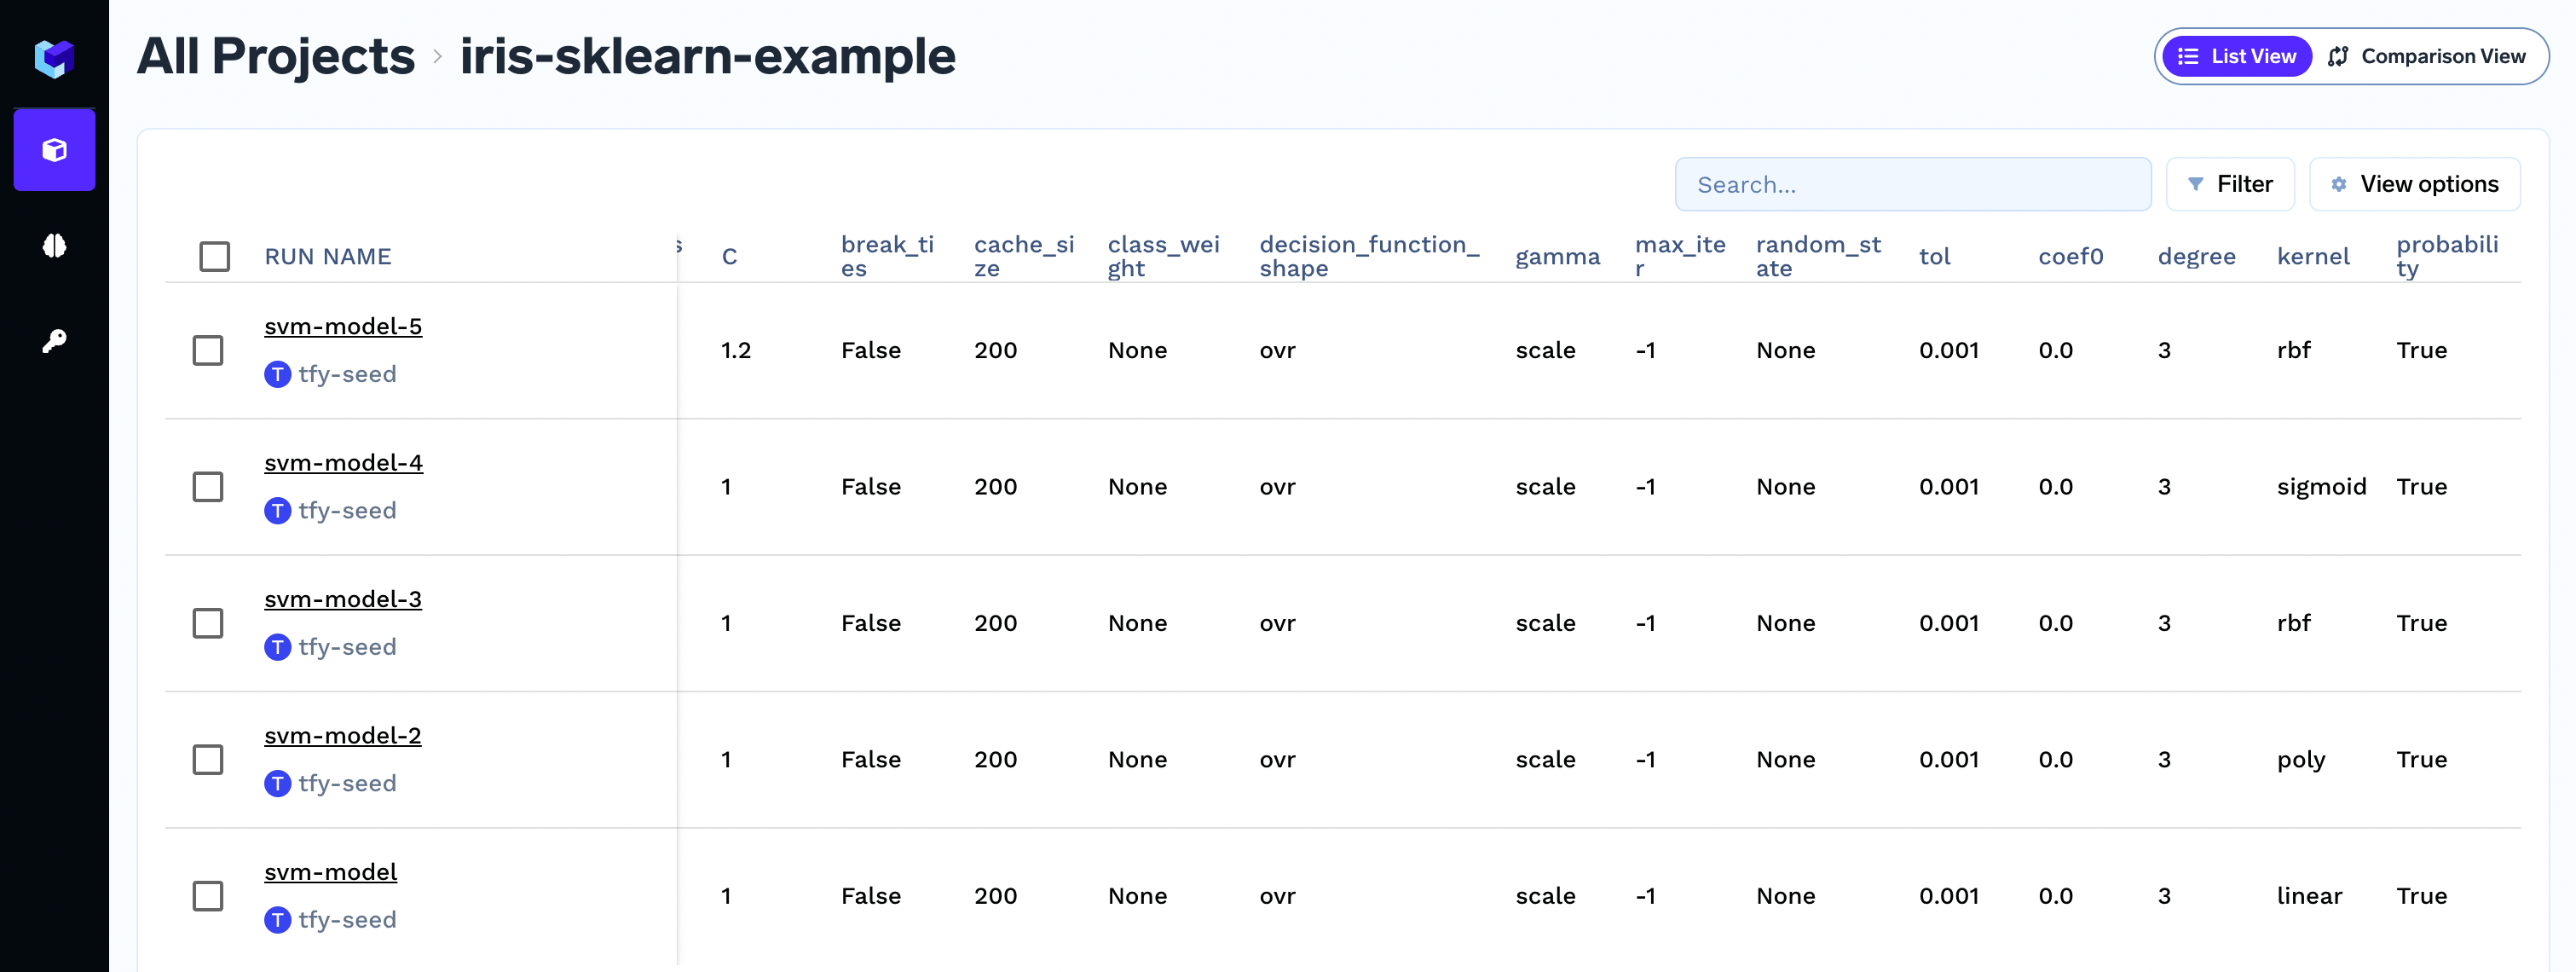
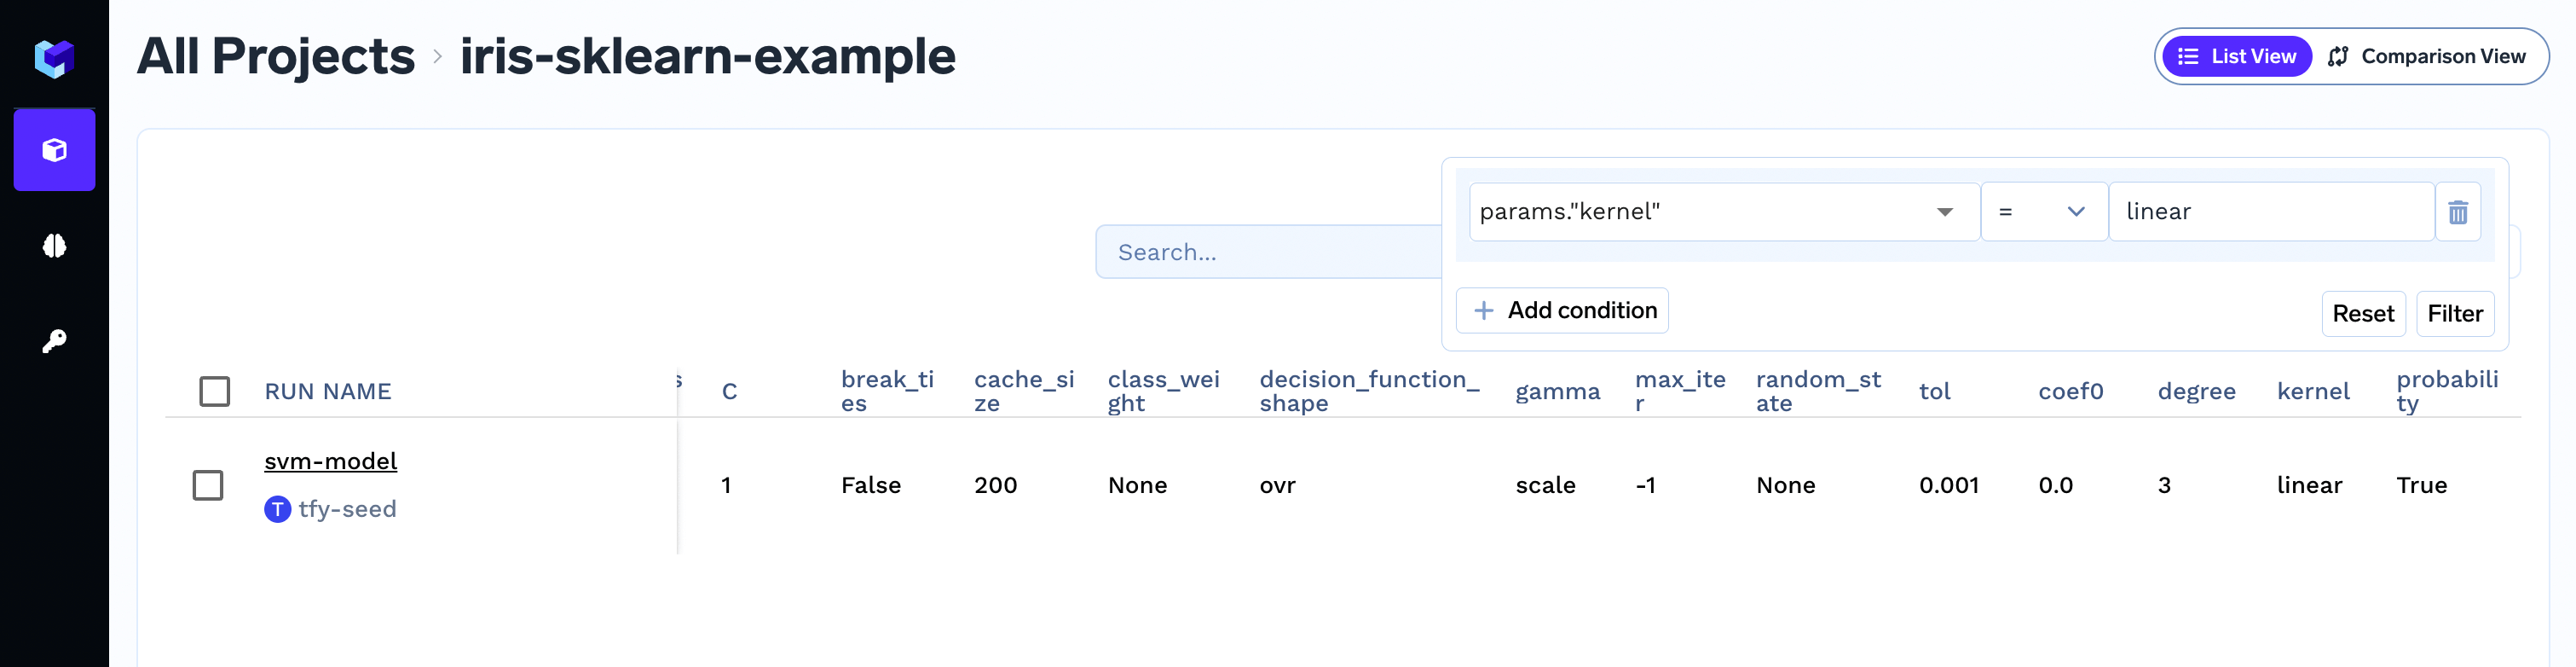
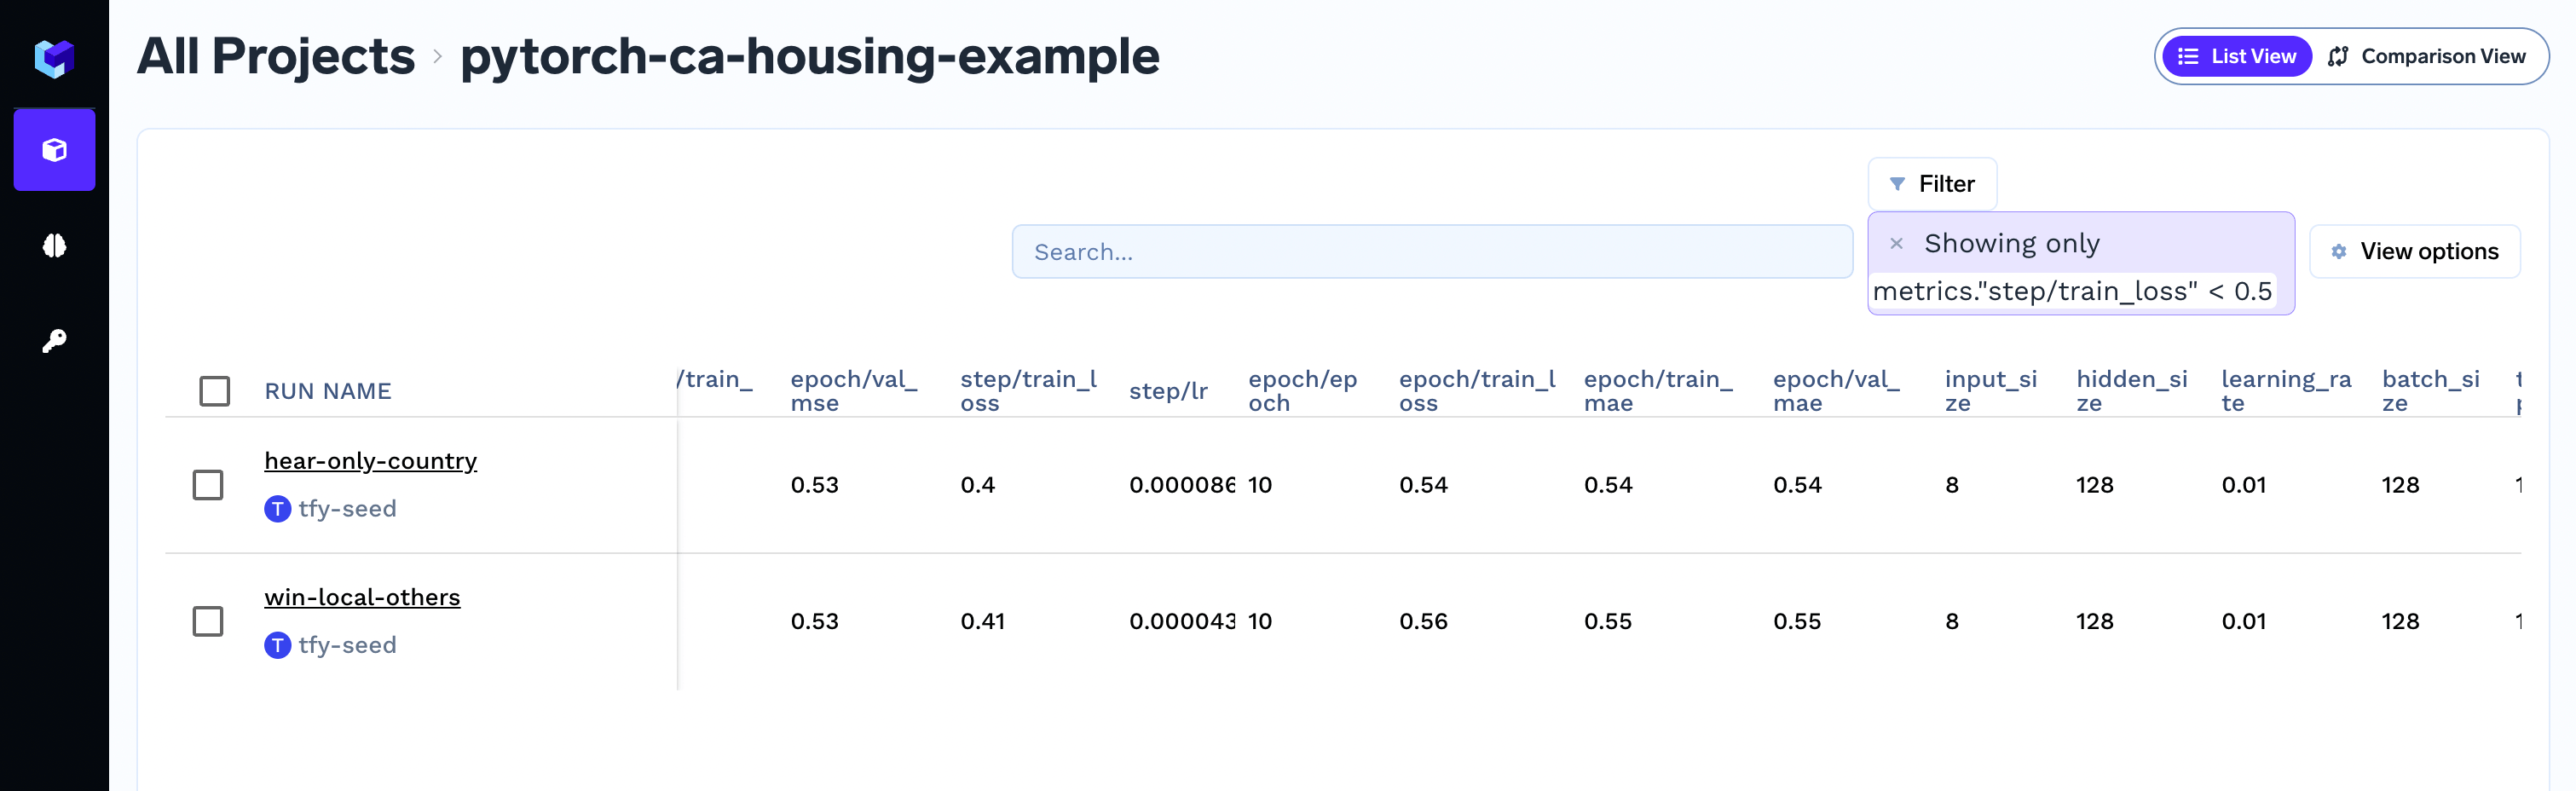
You can organize multiple runs under a single ml_repo. For example, the run svm-model will be created under the ml_repo iris-demo.Once you’ve created runs and logged data, you can view them in the TrueFoundry dashboard. Navigate to your job in the Platform → Applications tab, click on the job name, and go to the “Job Runs” tab to see all executions with their status, metrics, and parameters.
Job Runs Dashboard - Example showing multiple runs with different statuses
from truefoundry.ml import get_clientclient = get_client()run = client.create_run(ml_repo="iris-demo", run_name="svm-model")# Your code here.run.end()
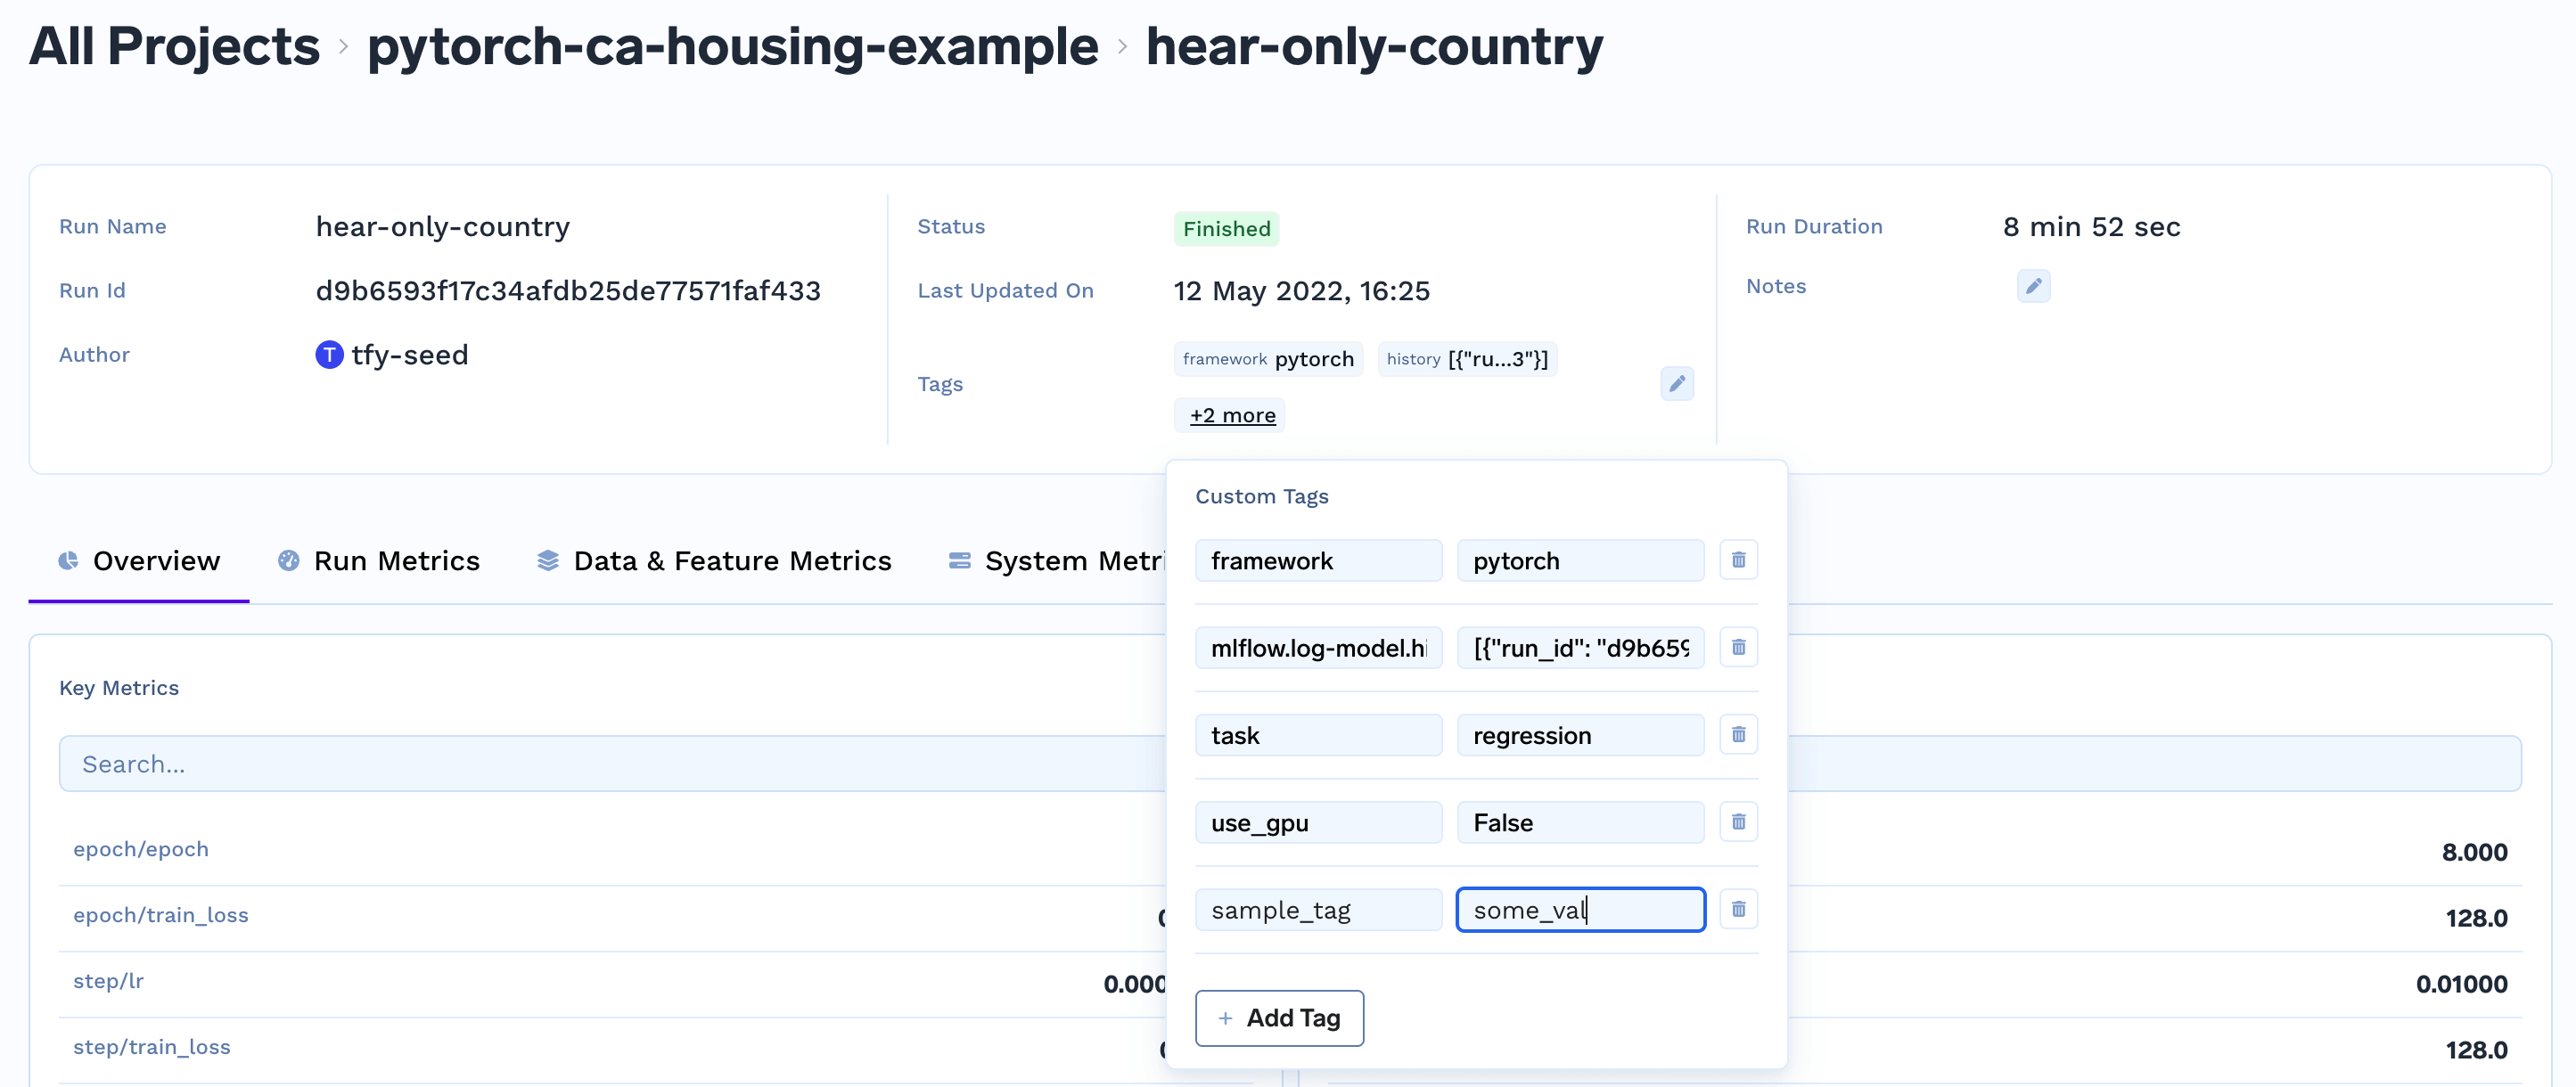
Adding tags to a run
from truefoundry.ml import get_clientclient = get_client()run = client.create_run(ml_repo="iris-demo", run_name="svm-model")run.set_tags({"env": "development", "task": "classification"})# Your code here.run.end()
You can view the tags from the dashboard and also create new tags.
Logging parameters
Parameters are used to store the configuration of a run. This can be either the inputs to your script or the hyperparameters of your model during training like learning_rate, cache_size.
The parameter values are stringified before storing.You can log parameters using the log_params as shown below:
Parameters are immutable and you cannot change the value of param once logged.
If you need to change the value of param, it basically means that you are
changing your input configuration and it’s best to create a new run for that.
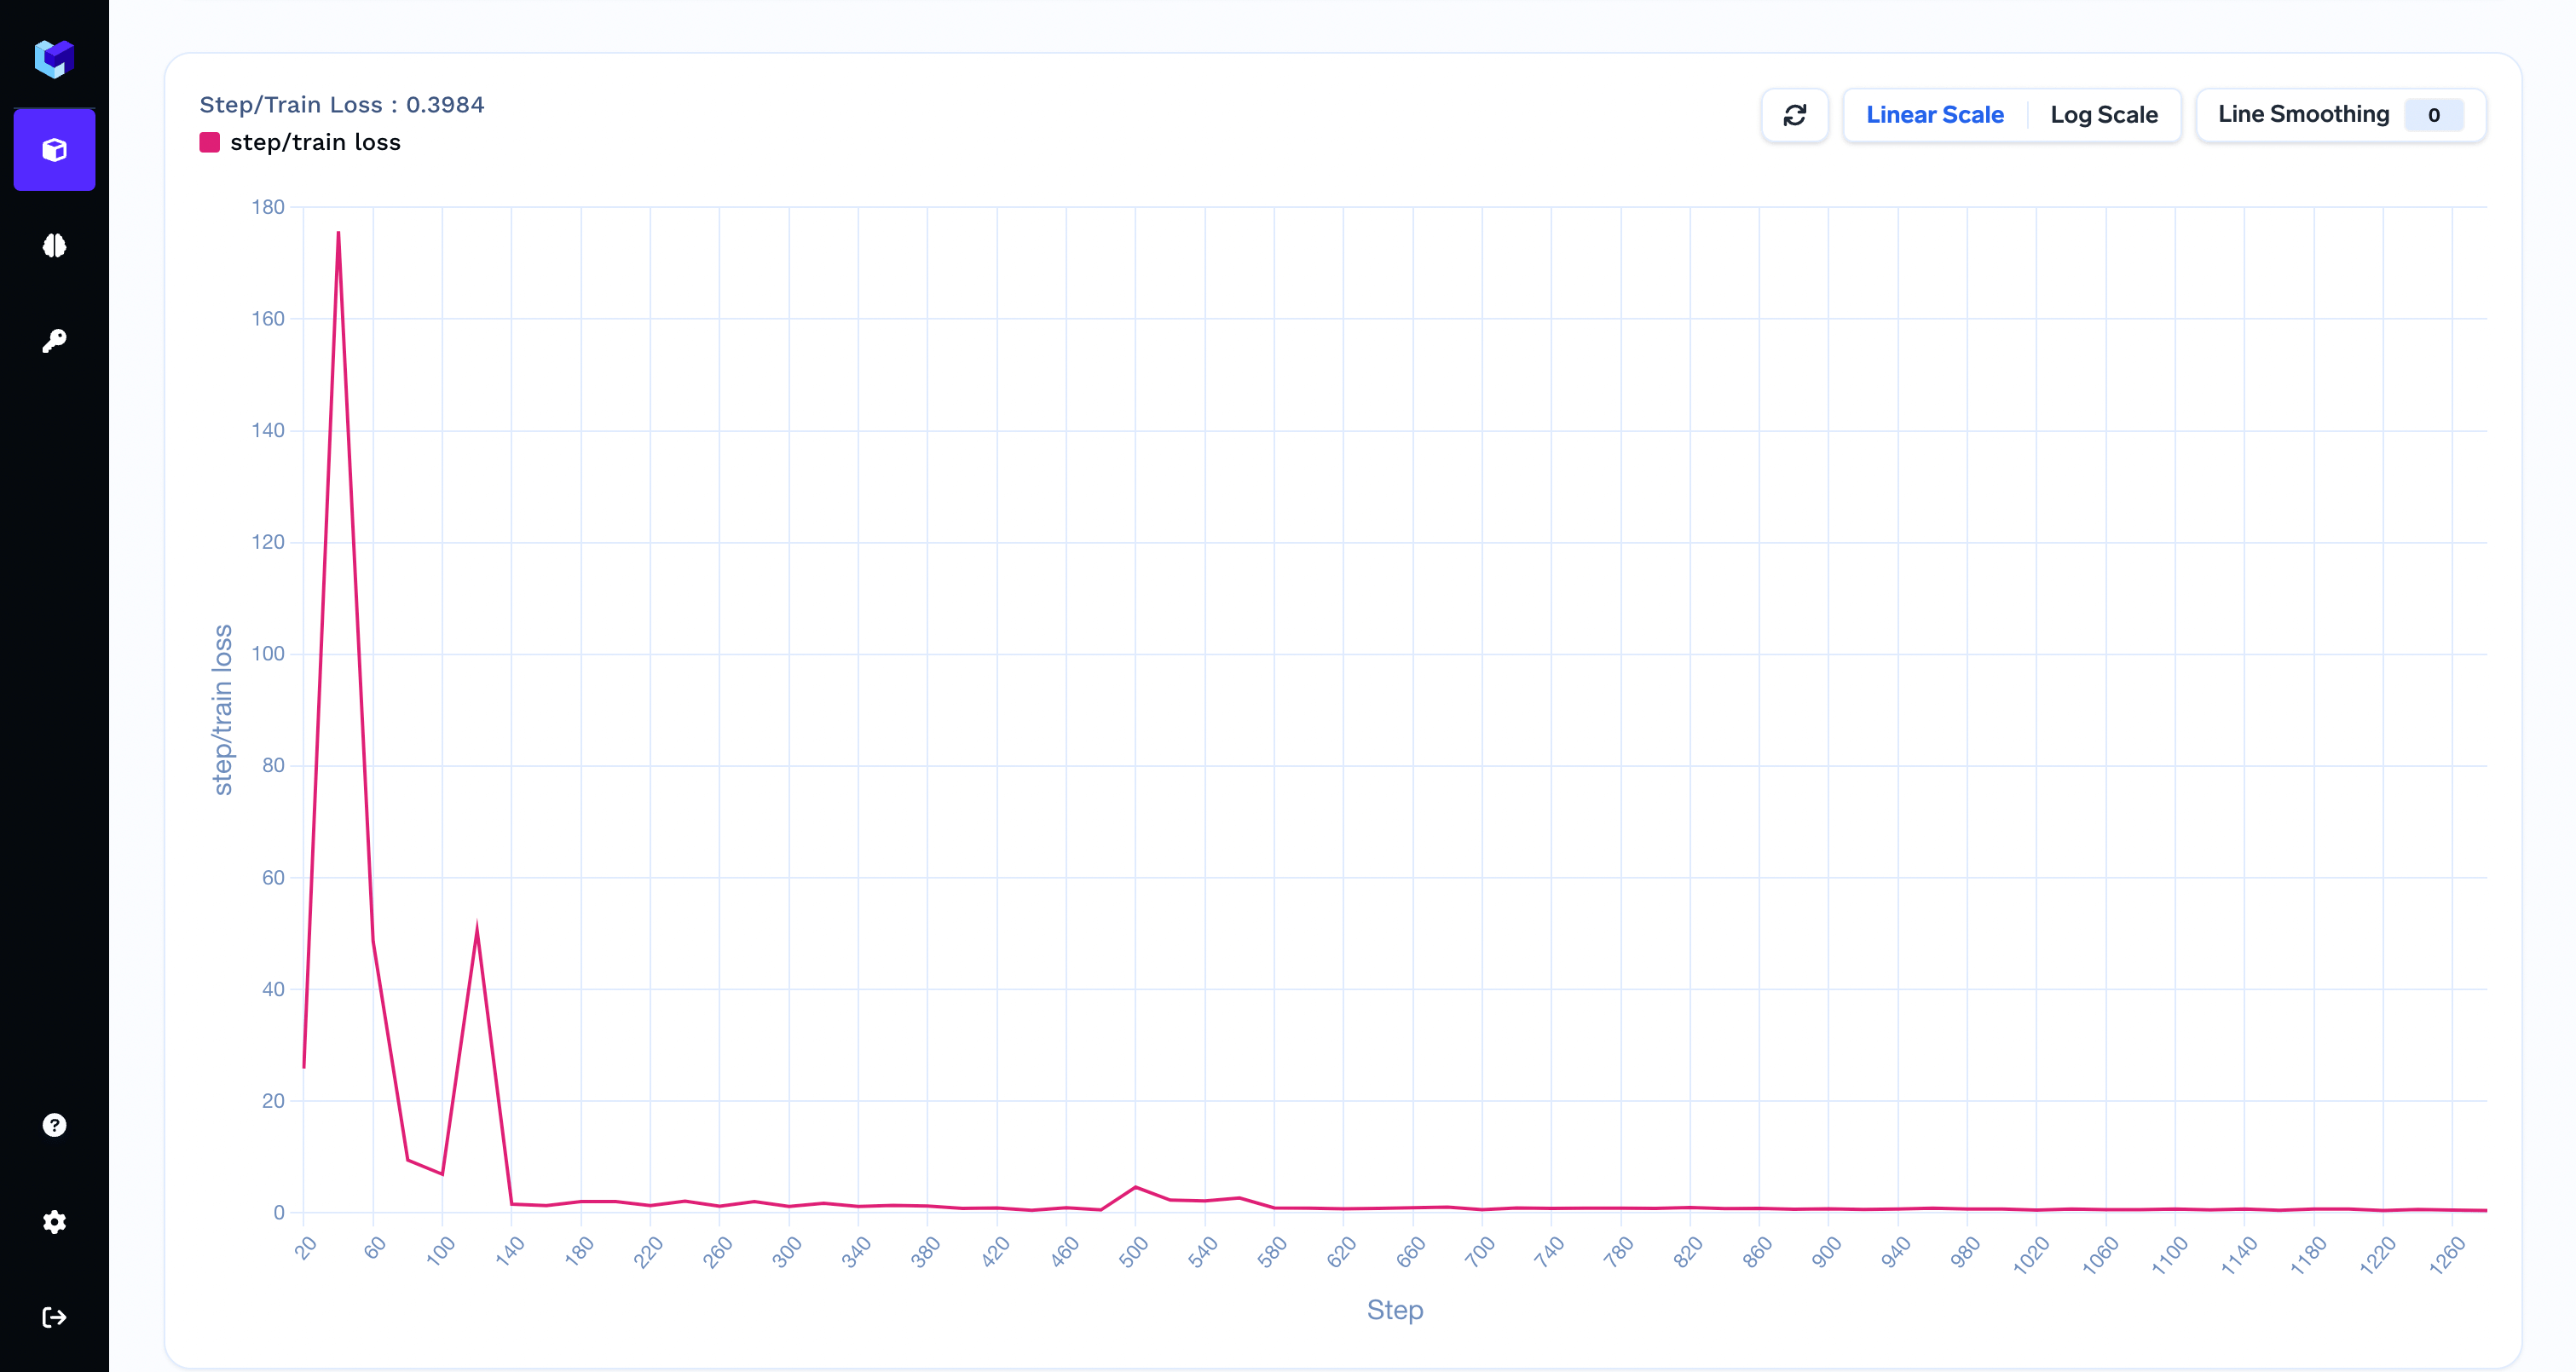
Metrics are values that help you to evaluate and compare different runs - for e.g. accuracy, f1 score. You can log any output of your script as a metric.You can capture metrics using the log_metrics method.
Should I use epoch or global step as a value for the step argument in the run?
If available you should use the global step as a value for the step argument. To capture epoch-level metric aggregates, you can use the following pattern.
import osfrom truefoundry.ml import get_clientfrom truefoundry.ml import ArtifactPathclient = get_client()run = client.create_run(ml_repo="iris-demo", run_name="svm-model")run.log_params({"cache_size": 200.0, "kernel": "linear"})run.log_metrics(metric_dict={"accuracy": 0.7, "loss": 0.6})# Just creating sample files to log as artifacts# os.makedirs("my-folder", exist_ok=True)# with open("my-folder/file-inside-folder.txt", "w") as f:# f.write("Hello!")# with open("just-a-file.txt", "w") as f:# f.write("Hello from file!")artifact_version = run.log_artifact( name="my-artifact", artifact_paths=[ # Add files and folders here, `ArtifactPath` takes source and destination # source can be single file path or folder path # destination can be file path or folder path # Note: When source is a folder path, destination is always interpreted as folder path ArtifactPath(src="just-a-file.txt"), ArtifactPath(src="my-folder/", dest="cool-dir"), ArtifactPath(src="just-a-file.txt", dest="cool-dir/copied-file.txt") ], description="This is a sample artifact", metadata={"created_by": "my-username"})print(artifact_version.fqn)run.end()
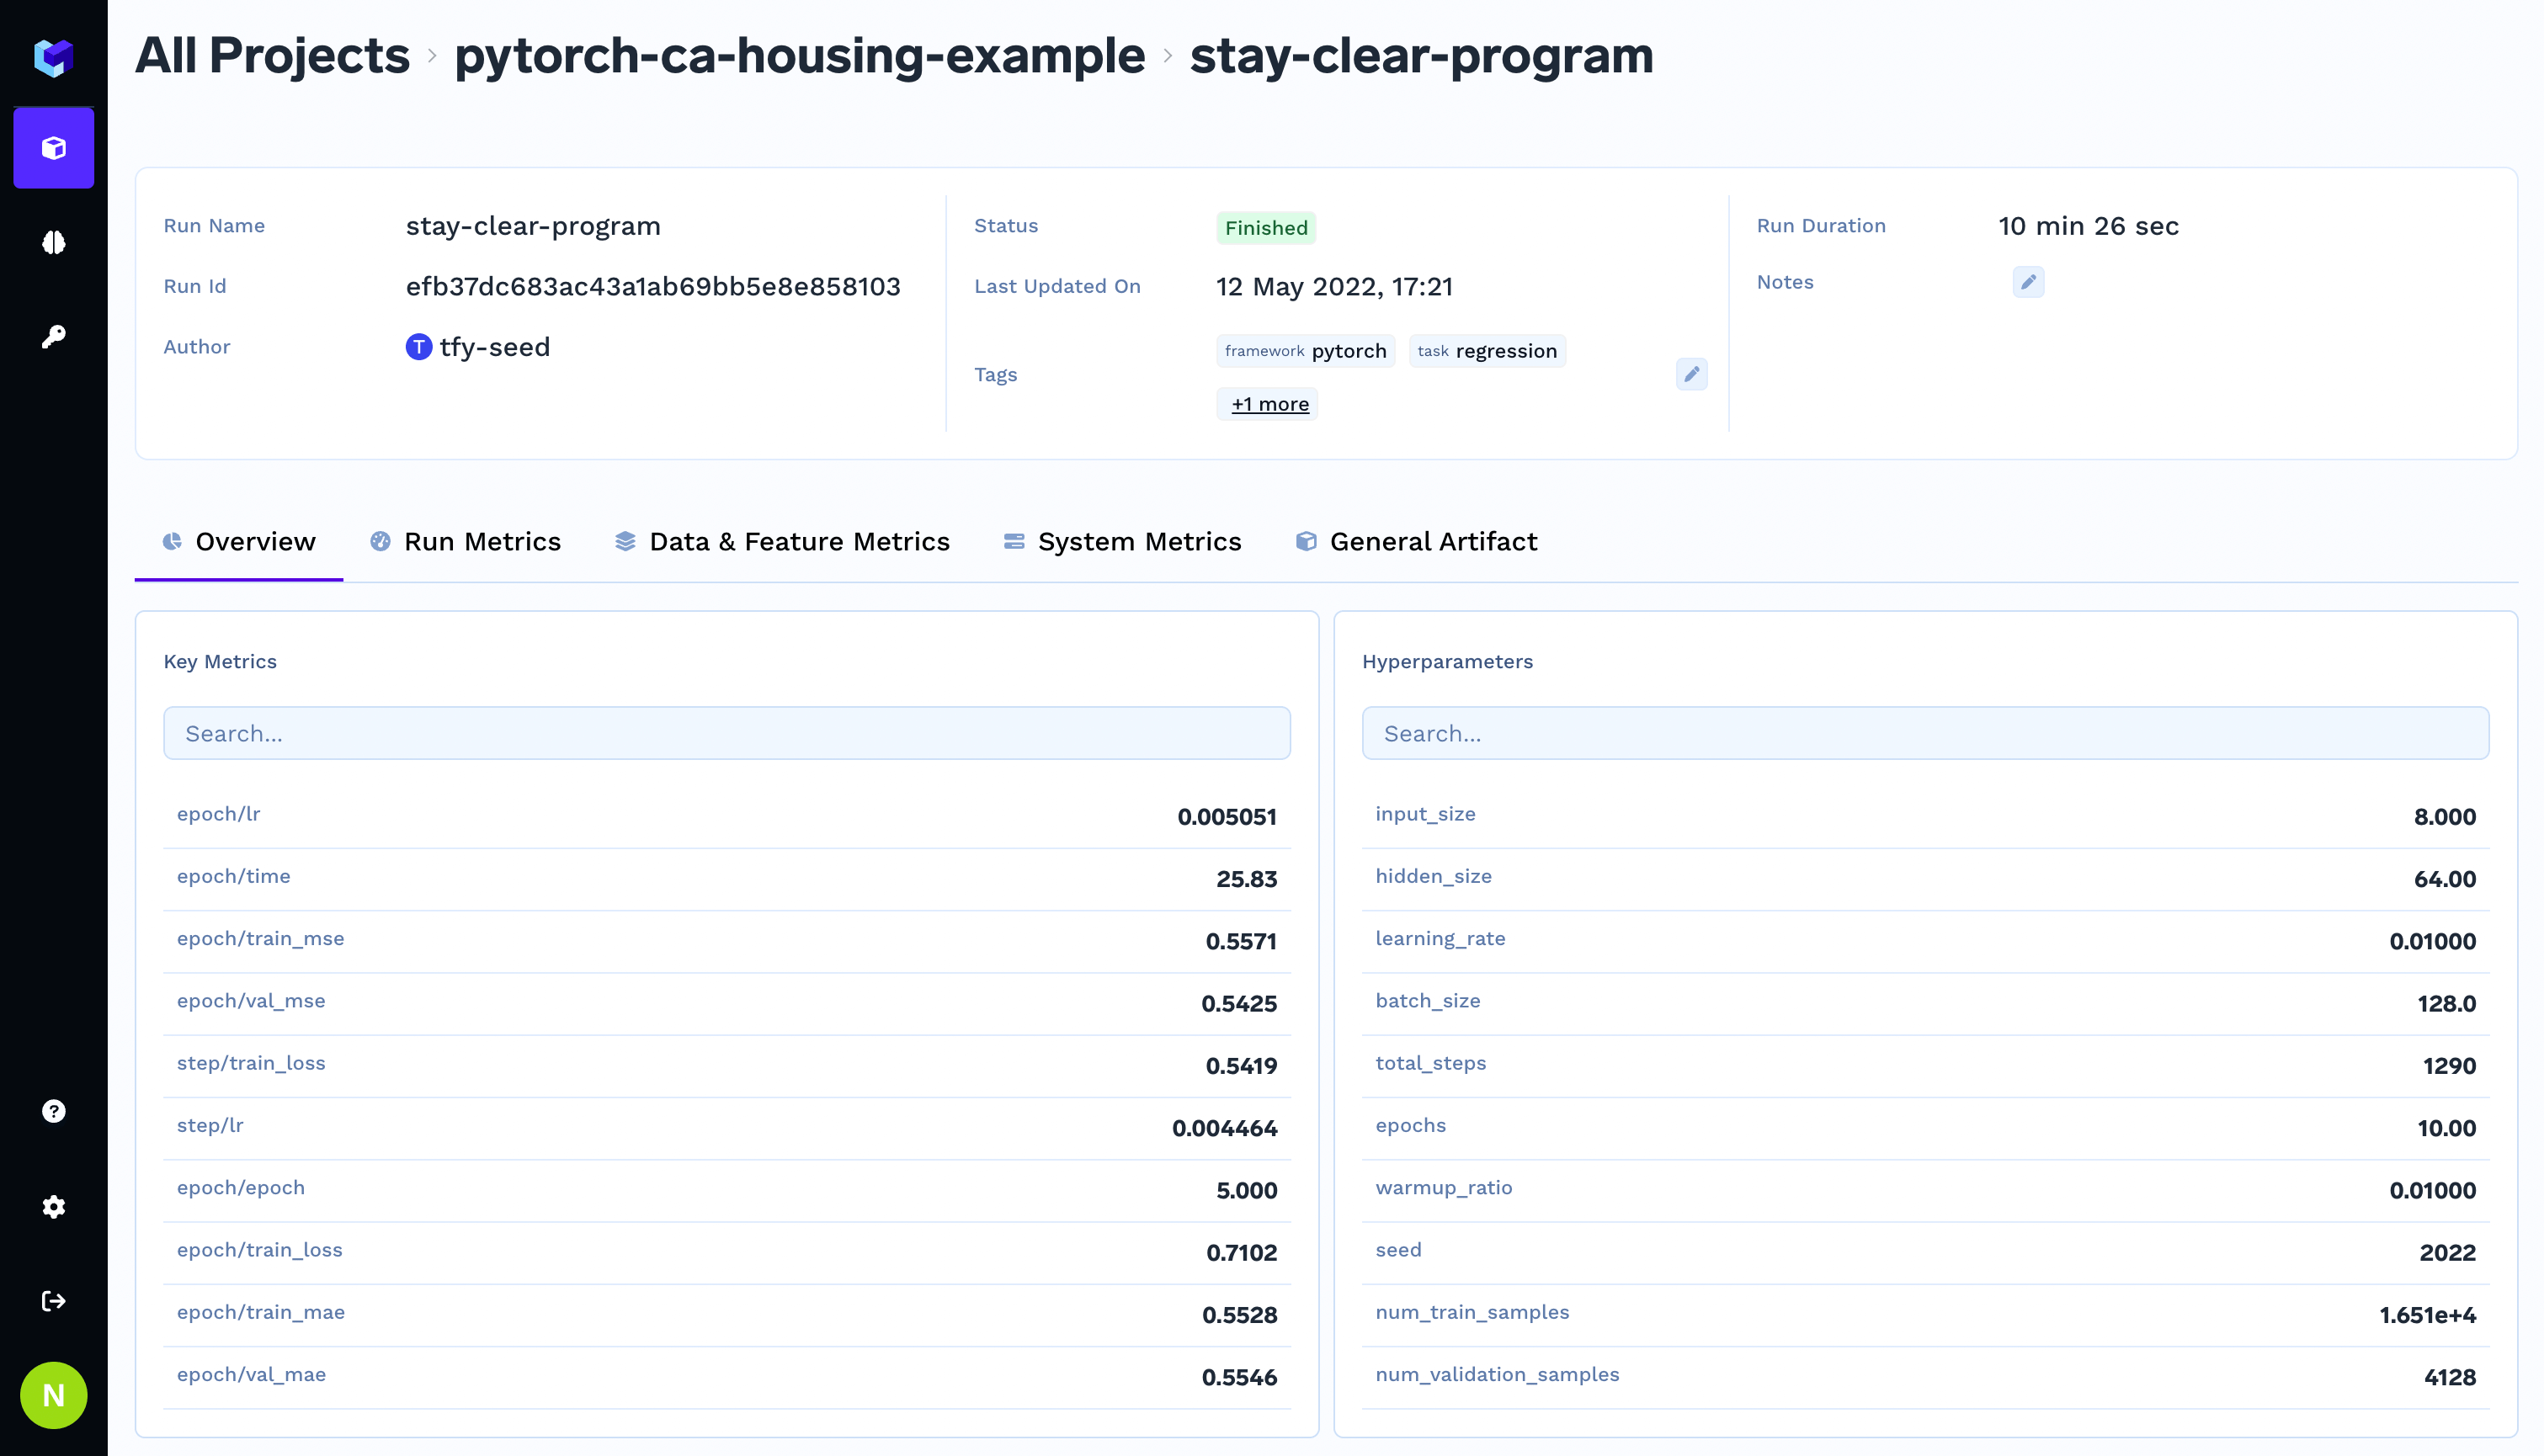
In the Job Runs table, you’ll notice that the “RUN DETAILS” column contains clickable links. When you click on any run details link, you’ll be taken to a comprehensive view of that specific run, which includes:
Overview Tab: Key metrics and hyperparameters used in the run
Results Tab: Detailed metrics and performance data
Models Tab: All logged models with their metadata
Artifacts Tab: Files and artifacts associated with the run
Pro Tip: Use the run details view to analyze your experiments, compare
different hyperparameter configurations, and track the progress of your
machine learning projects over time.
Was this page helpful?
Assistant
Responses are generated using AI and may contain mistakes.