> ## Documentation Index
> Fetch the complete documentation index at: https://www.truefoundry.com/llms.txt
> Use this file to discover all available pages before exploring further.
# Prometheus Grafana Integration
> Learn how to monitor your TrueFoundry AI Gateway using Prometheus metrics and Grafana dashboards for performance, cost, and usage insights.
The tfy-llm-gateway provides detailed, Prometheus-compatible metrics to monitor the health, performance, and cost of your LLM applications with Grafana.
**You will be able to export metrics only if the gateway is hosted on your end.**
## Setup
The gateway exposes a `/metrics` endpoint that can be scraped by your Prometheus instance. This is the standard way to collect metrics.
Alternatively, if your setup uses an OpenTelemetry Collector, you can configure the gateway to push metrics directly. To do this, set the following environment variables for the `tfy-llm-gateway` service:
* `ENABLE_OTEL_METRICS`: Set to `"true"`.
* `OTEL_EXPORTER_OTLP_METRICS_ENDPOINT`: The endpoint of your OTEL metrics exporter.
* `OTEL_EXPORTER_OTLP_METRICS_HEADERS`: (Optional) Headers for authentication.
### Example Push Configuration
```yaml lines theme={"dark"}
ENABLE_OTEL_METRICS: 'true'
OTEL_EXPORTER_OTLP_METRICS_ENDPOINT: https:///api/v1/otlp/v1/metrics
OTEL_EXPORTER_OTLP_METRICS_HEADERS: 'Authorization=Bearer '
LLM_GATEWAY_METADATA_LOGGING_KEYS: '["customer_id", "request_type"]'
```
## Labels
Labels provide dimensions for filtering and aggregating metrics.
| Label | Description |
| ----------------------- | --------------------------------------------------------------------------------------------------------------------------------------- |
| `model_name` | The name of the model used for the request (e.g., `gpt-4o`). |
| `tenant_name` | The name of the tenant associated with the request. |
| `username` | The user associated with the request. |
| `ai_gateway_metadata_*` | Custom labels generated from `LLM_GATEWAY_METADATA_LOGGING_KEYS`. For example, `customer_id` becomes `ai_gateway_metadata_customer_id`. |
## Gateway Metrics
These metrics provide an overview of the gateway's performance and usage.
### Request Count
| Metric Name | Type | Description | Labels |
| --------------------------- | ------- | -------------------------------------------- | ---------------------------------------------------------------- |
| `ai_gateway_requests_total` | Counter | Total number of incoming inference requests. | `model_name`, `tenant_name`, `username`, `ai_gateway_metadata_*` |
### Token Usage and Cost
| Metric Name | Type | Description | Labels |
| -------------------------------- | ------- | -------------------------------------- | ---------------------------------------------------------------- |
| `ai_gateway_input_tokens_total` | Counter | The number of input tokens processed. | `model_name`, `tenant_name`, `username`, `ai_gateway_metadata_*` |
| `ai_gateway_output_tokens_total` | Counter | The number of output tokens generated. | `model_name`, `tenant_name`, `username`, `ai_gateway_metadata_*` |
| `ai_gateway_request_cost_total` | Counter | The estimated cost of the tokens used. | `model_name`, `tenant_name`, `username`, `ai_gateway_metadata_*` |
### Latency
| Metric Name | Type | Description | Labels |
| ----------------------------------- | --------- | ------------------------------------------------------- | ---------------------------------------------------------------- |
| `ai_gateway_request_processing_ms` | Histogram | The total time taken to process a request. | `model_name`, `tenant_name`, `username`, `ai_gateway_metadata_*` |
| `ai_gateway_first_token_latency_ms` | Histogram | The time to receive the first token from the model. | `model_name`, `tenant_name`, `username`, `ai_gateway_metadata_*` |
| `ai_gateway_inter_token_latency_ms` | Histogram | The average time between subsequent tokens in a stream. | `model_name`, `tenant_name`, `username`, `ai_gateway_metadata_*` |
### Errors and Failures
| Metric Name | Type | Description | Labels |
| -------------------------------------------------- | ------- | ---------------------------------------------- | ------------------------------------------------------------------------------ |
| `ai_gateway_request_model_inference_failure_total` | Counter | The number of failed model inference requests. | `model_name`, `tenant_name`, `username`, `error_code`, `ai_gateway_metadata_*` |
### Configuration Metrics
#### Rate Limiting
| Metric Name | Type | Description | Labels |
| --------------------------------------- | ------- | --------------------------------------------------- | -------------------------------------------------------------------------- |
| `ai_gateway_rate_limit_applied_total` | Counter | Total number of requests blocked due to rate limit. | `model_name`, `tenant_name`, `username`, `ruleId`, `ai_gateway_metadata_*` |
| `ai_gateway_rate_limit_nominated_total` | Counter | Total number of rate limit checks performed. | `model_name`, `tenant_name`, `username`, `ruleId`, `ai_gateway_metadata_*` |
#### Budget
| Metric Name | Type | Description | Labels |
| ----------------------------------- | ------- | ----------------------------------------------- | -------------------------------------------------------------------------- |
| `ai_gateway_budget_applied_total` | Counter | Total number of requests blocked due to budget. | `model_name`, `tenant_name`, `username`, `ruleId`, `ai_gateway_metadata_*` |
| `ai_gateway_budget_nominated_total` | Counter | Total number of budget checks performed. | `model_name`, `tenant_name`, `username`, `ruleId`, `ai_gateway_metadata_*` |
#### Load Balancing
| Metric Name | Type | Description | Labels |
| ----------------------------------------- | ------- | ------------------------------------------------------ | -------------------------------------------------------------------------- |
| `ai_gateway_load_balanced_requests_total` | Counter | Total number of requests that were load balanced. | `model_name`, `tenant_name`, `username`, `ruleId`, `ai_gateway_metadata_*` |
| `ai_gateway_fallback_requests_total` | Counter | Total number of requests that were served by fallback. | `model_name`, `tenant_name`, `username`, `ruleId`, `ai_gateway_metadata_*` |
#### Guardrails
| Metric Name | Type | Description | Labels |
| ------------------------------------------- | --------- | ------------------------------------------------- | ----------------------------------------------------------------------------------- |
| `ai_gateway_guardrail_requests_total` | Counter | Total number of guardrail checks with status. | `model_name`, `tenant_name`, `username`, `scope`, `result`, `ai_gateway_metadata_*` |
| `ai_gateway_guardrail_execution_latency_ms` | Histogram | Time spent executing individual guardrail checks. | `model_name`, `tenant_name`, `username`, `scope`, `ai_gateway_metadata_*` |
## Agent-Specific Metrics
These metrics are for monitoring agent-based interactions.
| Metric Name | Type | Description | Labels |
| -------------------------------------------------------- | --------- | ----------------------------------------------------------- | --------------------------------------------------------------------------------------- |
| `ai_gateway_agent_requests_total` | Counter | Total number of incoming agent requests to the gateway. | `model_name`, `tenant_name`, `username`, `ai_gateway_metadata_*` |
| `ai_gateway_agent_request_duration_ms` | Histogram | The total duration of an agent request. | `model_name`, `status`, `tenant_name`, `username`, `ai_gateway_metadata_*` |
| `ai_gateway_agent_request_tool_calls` | Histogram | The number of tool calls in a single agent request. | `model_name`, `tenant_name`, `username`, `ai_gateway_metadata_*` |
| `ai_gateway_agent_request_iteration_limit_reached_total` | Counter | The number of requests hitting the iteration limit. | `model_name`, `iteration_limit`, `tenant_name`, `username`, `ai_gateway_metadata_*` |
| `ai_gateway_agent_llm_latency_ms` | Histogram | The latency of LLM calls within an agent. | `model_name`, `status`, `tenant_name`, `username`, `ai_gateway_metadata_*` |
| `ai_gateway_agent_tool_calls_total` | Counter | The total number of tool calls made by agents. | `model_name`, `tenant_name`, `username`, `tool_name`, `ai_gateway_metadata_*` |
| `ai_gateway_agent_tool_latency_ms` | Histogram | The execution time of each tool call. | `model_name`, `tenant_name`, `username`, `tool_name`, `status`, `ai_gateway_metadata_*` |
| `ai_gateway_agent_mcp_connect_latency_ms` | Histogram | The time taken to connect to an MCP server and fetch tools. | `model_name`, `tenant_name`, `username`, `ai_gateway_metadata_*` |
## Grafana Integration
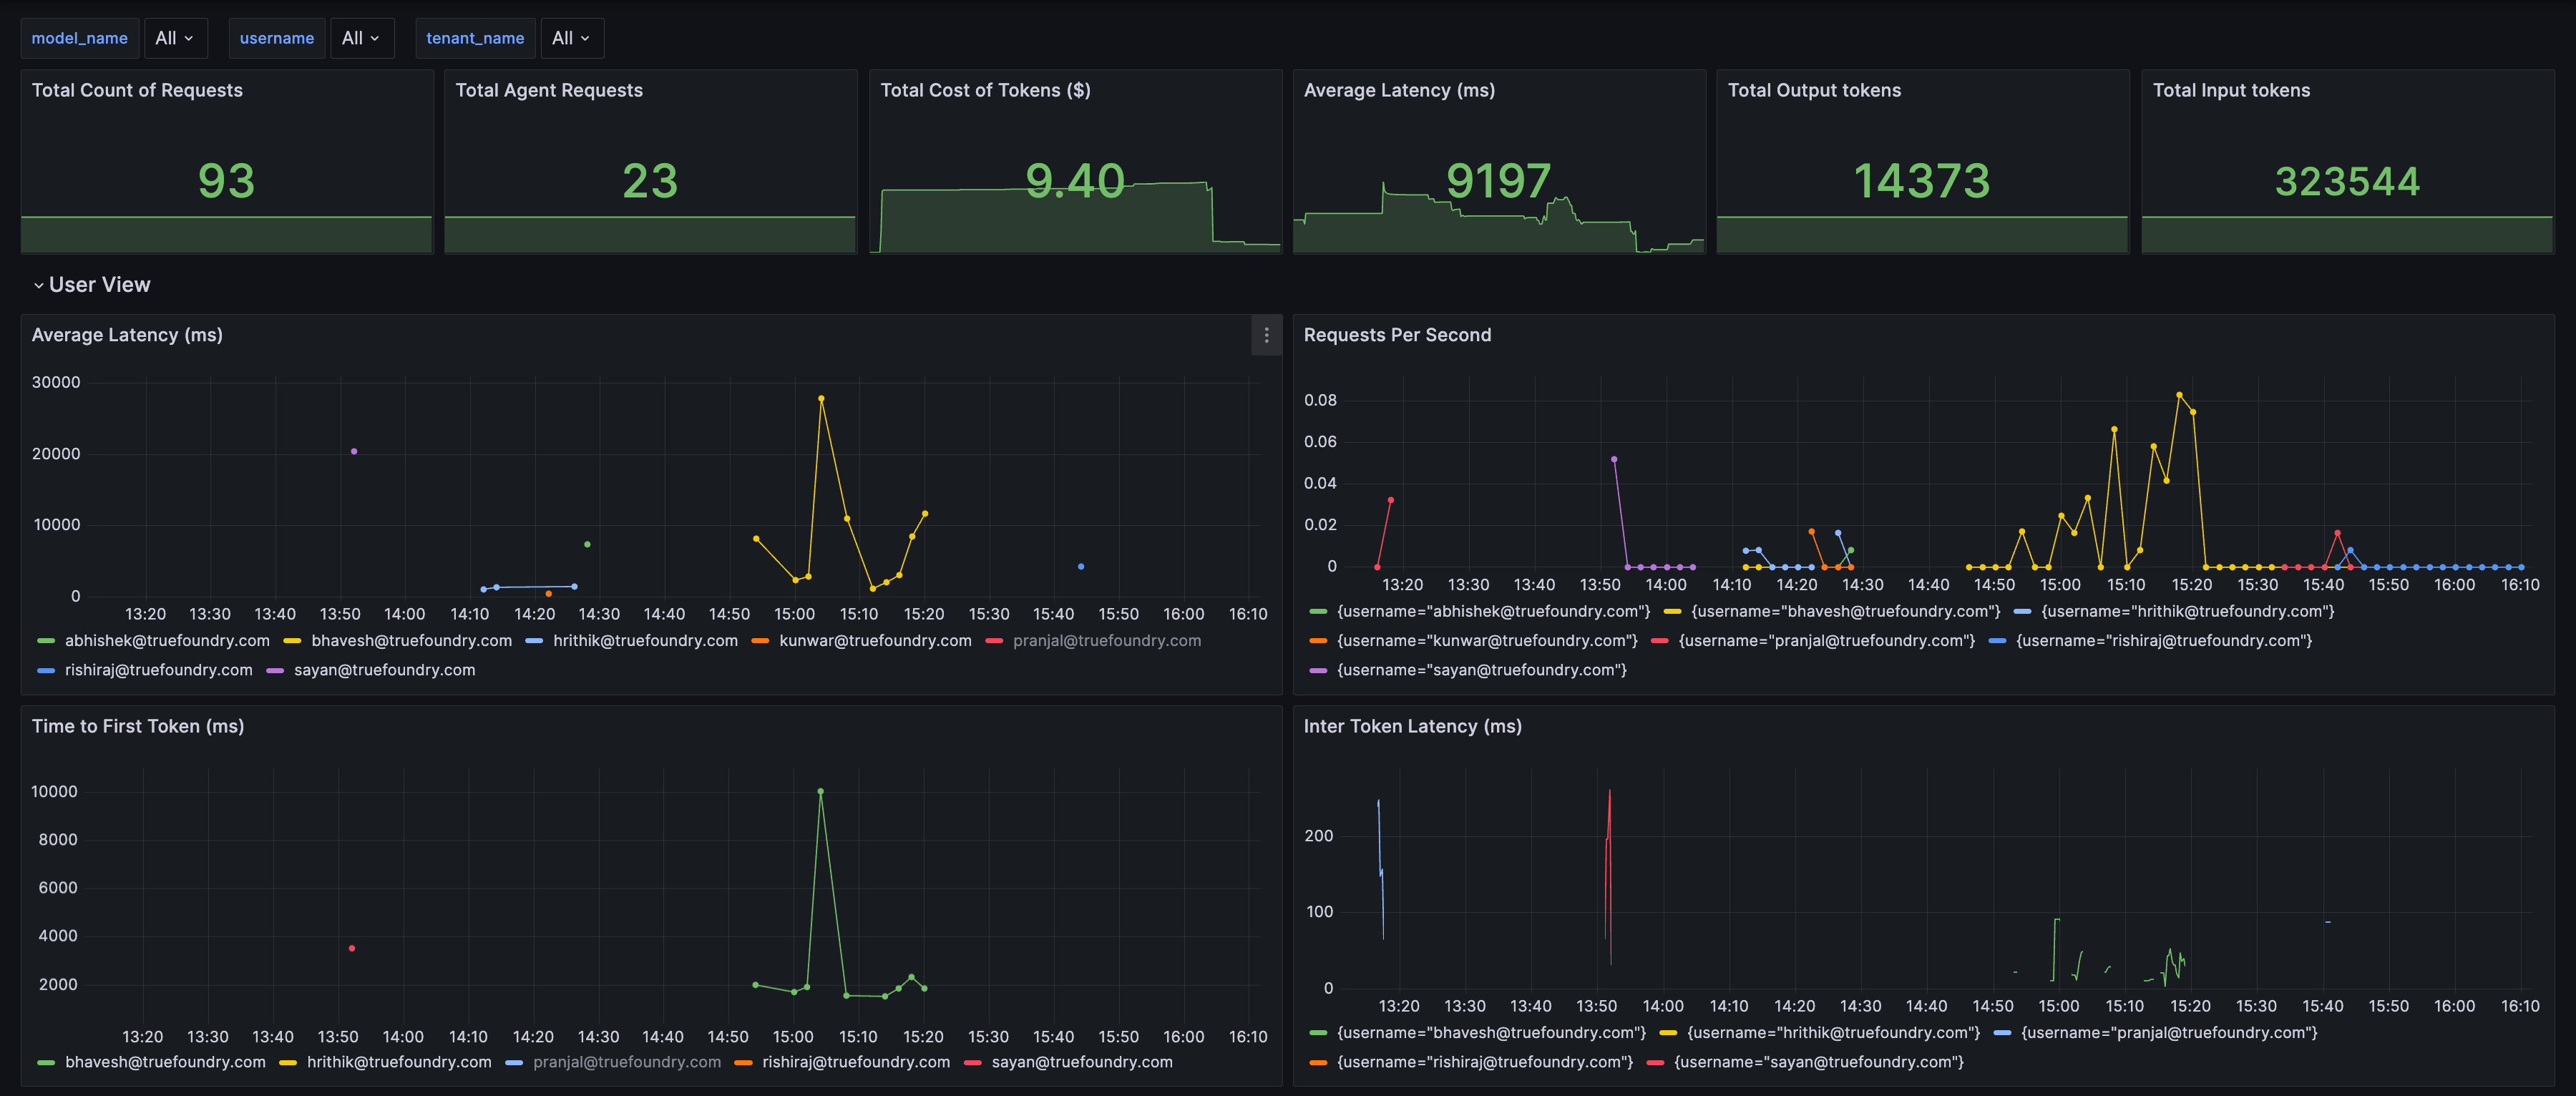
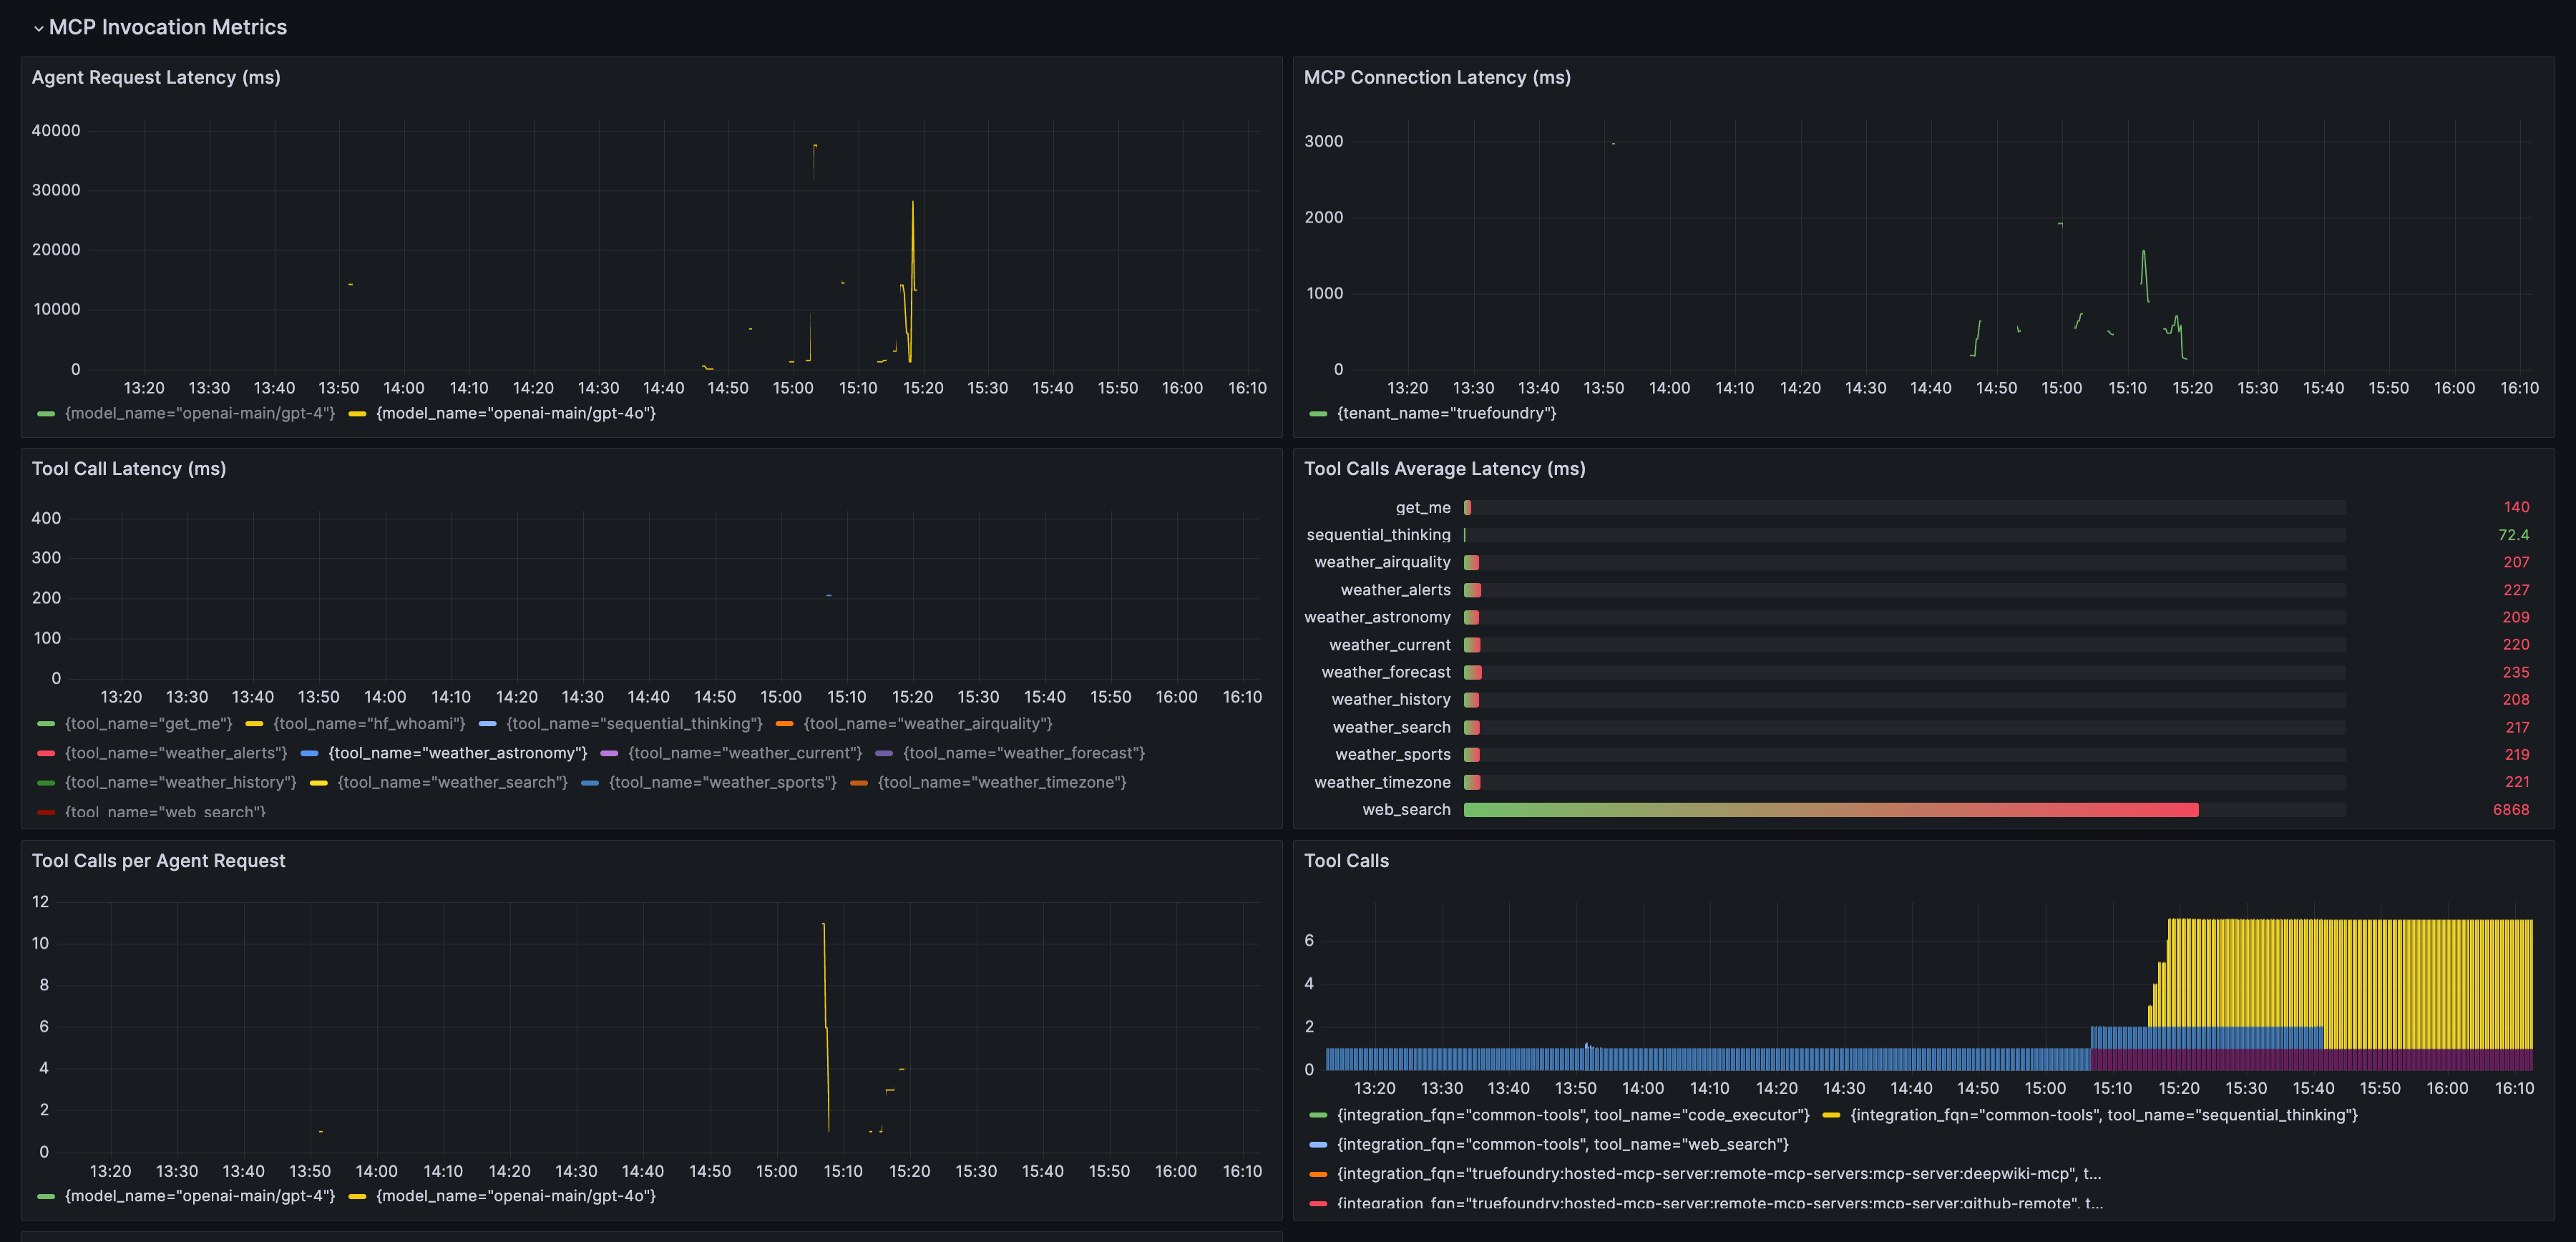
Our pre-built Grafana dashboard helps you monitor the LLM Gateway. It is organized into several views so you can analyze gateway activity from different perspectives.
> **Note**\
> You can find the Grafana Dashboard JSON at the following link:\
> [https://github.com/truefoundry/infra-charts/blob/main/charts/tfy-grafana/dashboards/llm-gateway-metrics.json](https://github.com/truefoundry/infra-charts/blob/main/charts/tfy-grafana/dashboards/llm-gateway-metrics.json)
### Dashboard Views
Our pre-built Grafana dashboard is organized into several views to help you analyze gateway activity from different perspectives:
* **Model View**: Groups metrics by `model_name` to compare model performance.
* **User View**: Groups metrics by `username` to monitor usage patterns.
* **Config View**: Groups metrics by `ruleId` to show the impact of gateway configurations.
* **MCP Invocation Metrics**: Contains all agent-related metrics, including MCP server performance and tool call latency.
 ### Importing the Dashboard
1. Copy the JSON dashboard definition below.
2. In your Grafana instance, navigate to **Dashboards** > **Import**.
3. Paste the JSON into the **Import via panel json** text area.
4. Click **Load**.
5. On the next screen, select your Prometheus data source.
6. Click **Import**.
### Customizing the Dashboard
The pre-built dashboard includes filters for `model_name`, `tenant_name`, and `username`. If you use custom metadata labels (via `LLM_GATEWAY_METADATA_LOGGING_KEYS`), you can add them as filters to your dashboard for more granular analysis.
#### Add a Dashboard Variable
For example, to filter by a custom metadata key like `customer_id`, add a new variable to your dashboard settings:
1. Go to **Dashboard settings** > **Variables**.
2. Click **New variable**.
3. Configure the variable as follows:
* **Name**: `customer_id`
* **Type**: `Query`
* **Label**: `Customer ID`
* **Data source**: Your Prometheus source
* **Query**: `label_values(ai_gateway_input_tokens_total, ai_gateway_metadata_customer_id)`
* **Multi-value**: Enabled
* **Include All option**: Enabled
#### Use the Variable in Queries
Update your panel queries to use the new variable. For example, to filter input tokens by `customer_id`:
```
sum(rate(ai_gateway_input_tokens_total{model_name=~"$model_name", tenant_name=~"$tenant_name", ai_gateway_metadata_customer_id=~"$customer_id"}[5m]))
```
### Importing the Dashboard
1. Copy the JSON dashboard definition below.
2. In your Grafana instance, navigate to **Dashboards** > **Import**.
3. Paste the JSON into the **Import via panel json** text area.
4. Click **Load**.
5. On the next screen, select your Prometheus data source.
6. Click **Import**.
### Customizing the Dashboard
The pre-built dashboard includes filters for `model_name`, `tenant_name`, and `username`. If you use custom metadata labels (via `LLM_GATEWAY_METADATA_LOGGING_KEYS`), you can add them as filters to your dashboard for more granular analysis.
#### Add a Dashboard Variable
For example, to filter by a custom metadata key like `customer_id`, add a new variable to your dashboard settings:
1. Go to **Dashboard settings** > **Variables**.
2. Click **New variable**.
3. Configure the variable as follows:
* **Name**: `customer_id`
* **Type**: `Query`
* **Label**: `Customer ID`
* **Data source**: Your Prometheus source
* **Query**: `label_values(ai_gateway_input_tokens_total, ai_gateway_metadata_customer_id)`
* **Multi-value**: Enabled
* **Include All option**: Enabled
#### Use the Variable in Queries
Update your panel queries to use the new variable. For example, to filter input tokens by `customer_id`:
```
sum(rate(ai_gateway_input_tokens_total{model_name=~"$model_name", tenant_name=~"$tenant_name", ai_gateway_metadata_customer_id=~"$customer_id"}[5m]))
```