> ## Documentation Index
> Fetch the complete documentation index at: https://www.truefoundry.com/llms.txt
> Use this file to discover all available pages before exploring further.
# New Relic
> Learn how to export LLM Gateway traces to New Relic using OpenTelemetry integration.
This guide provides instructions for integrating [New Relic](https://newrelic.com/) with the TrueFoundry AI Gateway to export OpenTelemetry traces.
## What is New Relic?
New Relic is a comprehensive observability platform that provides full-stack monitoring, application performance management (APM), and real-time analytics. It helps teams monitor, debug, and optimize their applications with powerful visualization and alerting capabilities.
### Key Features of New Relic
* **[Full-Stack Observability](https://newrelic.com/platform/full-stack-observability)**: Monitor your entire stack from infrastructure to applications with unified telemetry data
* **[AI-Powered Insights](https://newrelic.com/platform/new-relic-ai)**: Leverage AI-assisted analysis to quickly identify issues and optimize performance
* **[OpenTelemetry Native](https://docs.newrelic.com/docs/opentelemetry/get-started/opentelemetry-introduction/)**: Native support for OpenTelemetry with seamless OTLP ingestion
## Prerequisites
Before integrating New Relic with TrueFoundry, ensure you have:
1. **TrueFoundry Account**: Create a [TrueFoundry account](https://www.truefoundry.com/register) and follow the instructions in our [Gateway Quick Start Guide](https://docs.truefoundry.com/docs/ai-gateway/quick-start)
2. **New Relic Account**: Sign up for a [New Relic account](https://newrelic.com/signup)
3. **New Relic Ingest License Key**: Obtain your Ingest License key from the OpenTelemetry integration in New Relic
## Integration Guide
TrueFoundry AI Gateway supports exporting OpenTelemetry (OTEL) traces to external platforms like New Relic. This allows you to leverage New Relic's powerful observability features while using TrueFoundry for unified LLM access.
### Step 1: Get Your New Relic Ingest License Key
1. Log in to your [New Relic dashboard](https://one.newrelic.com/)
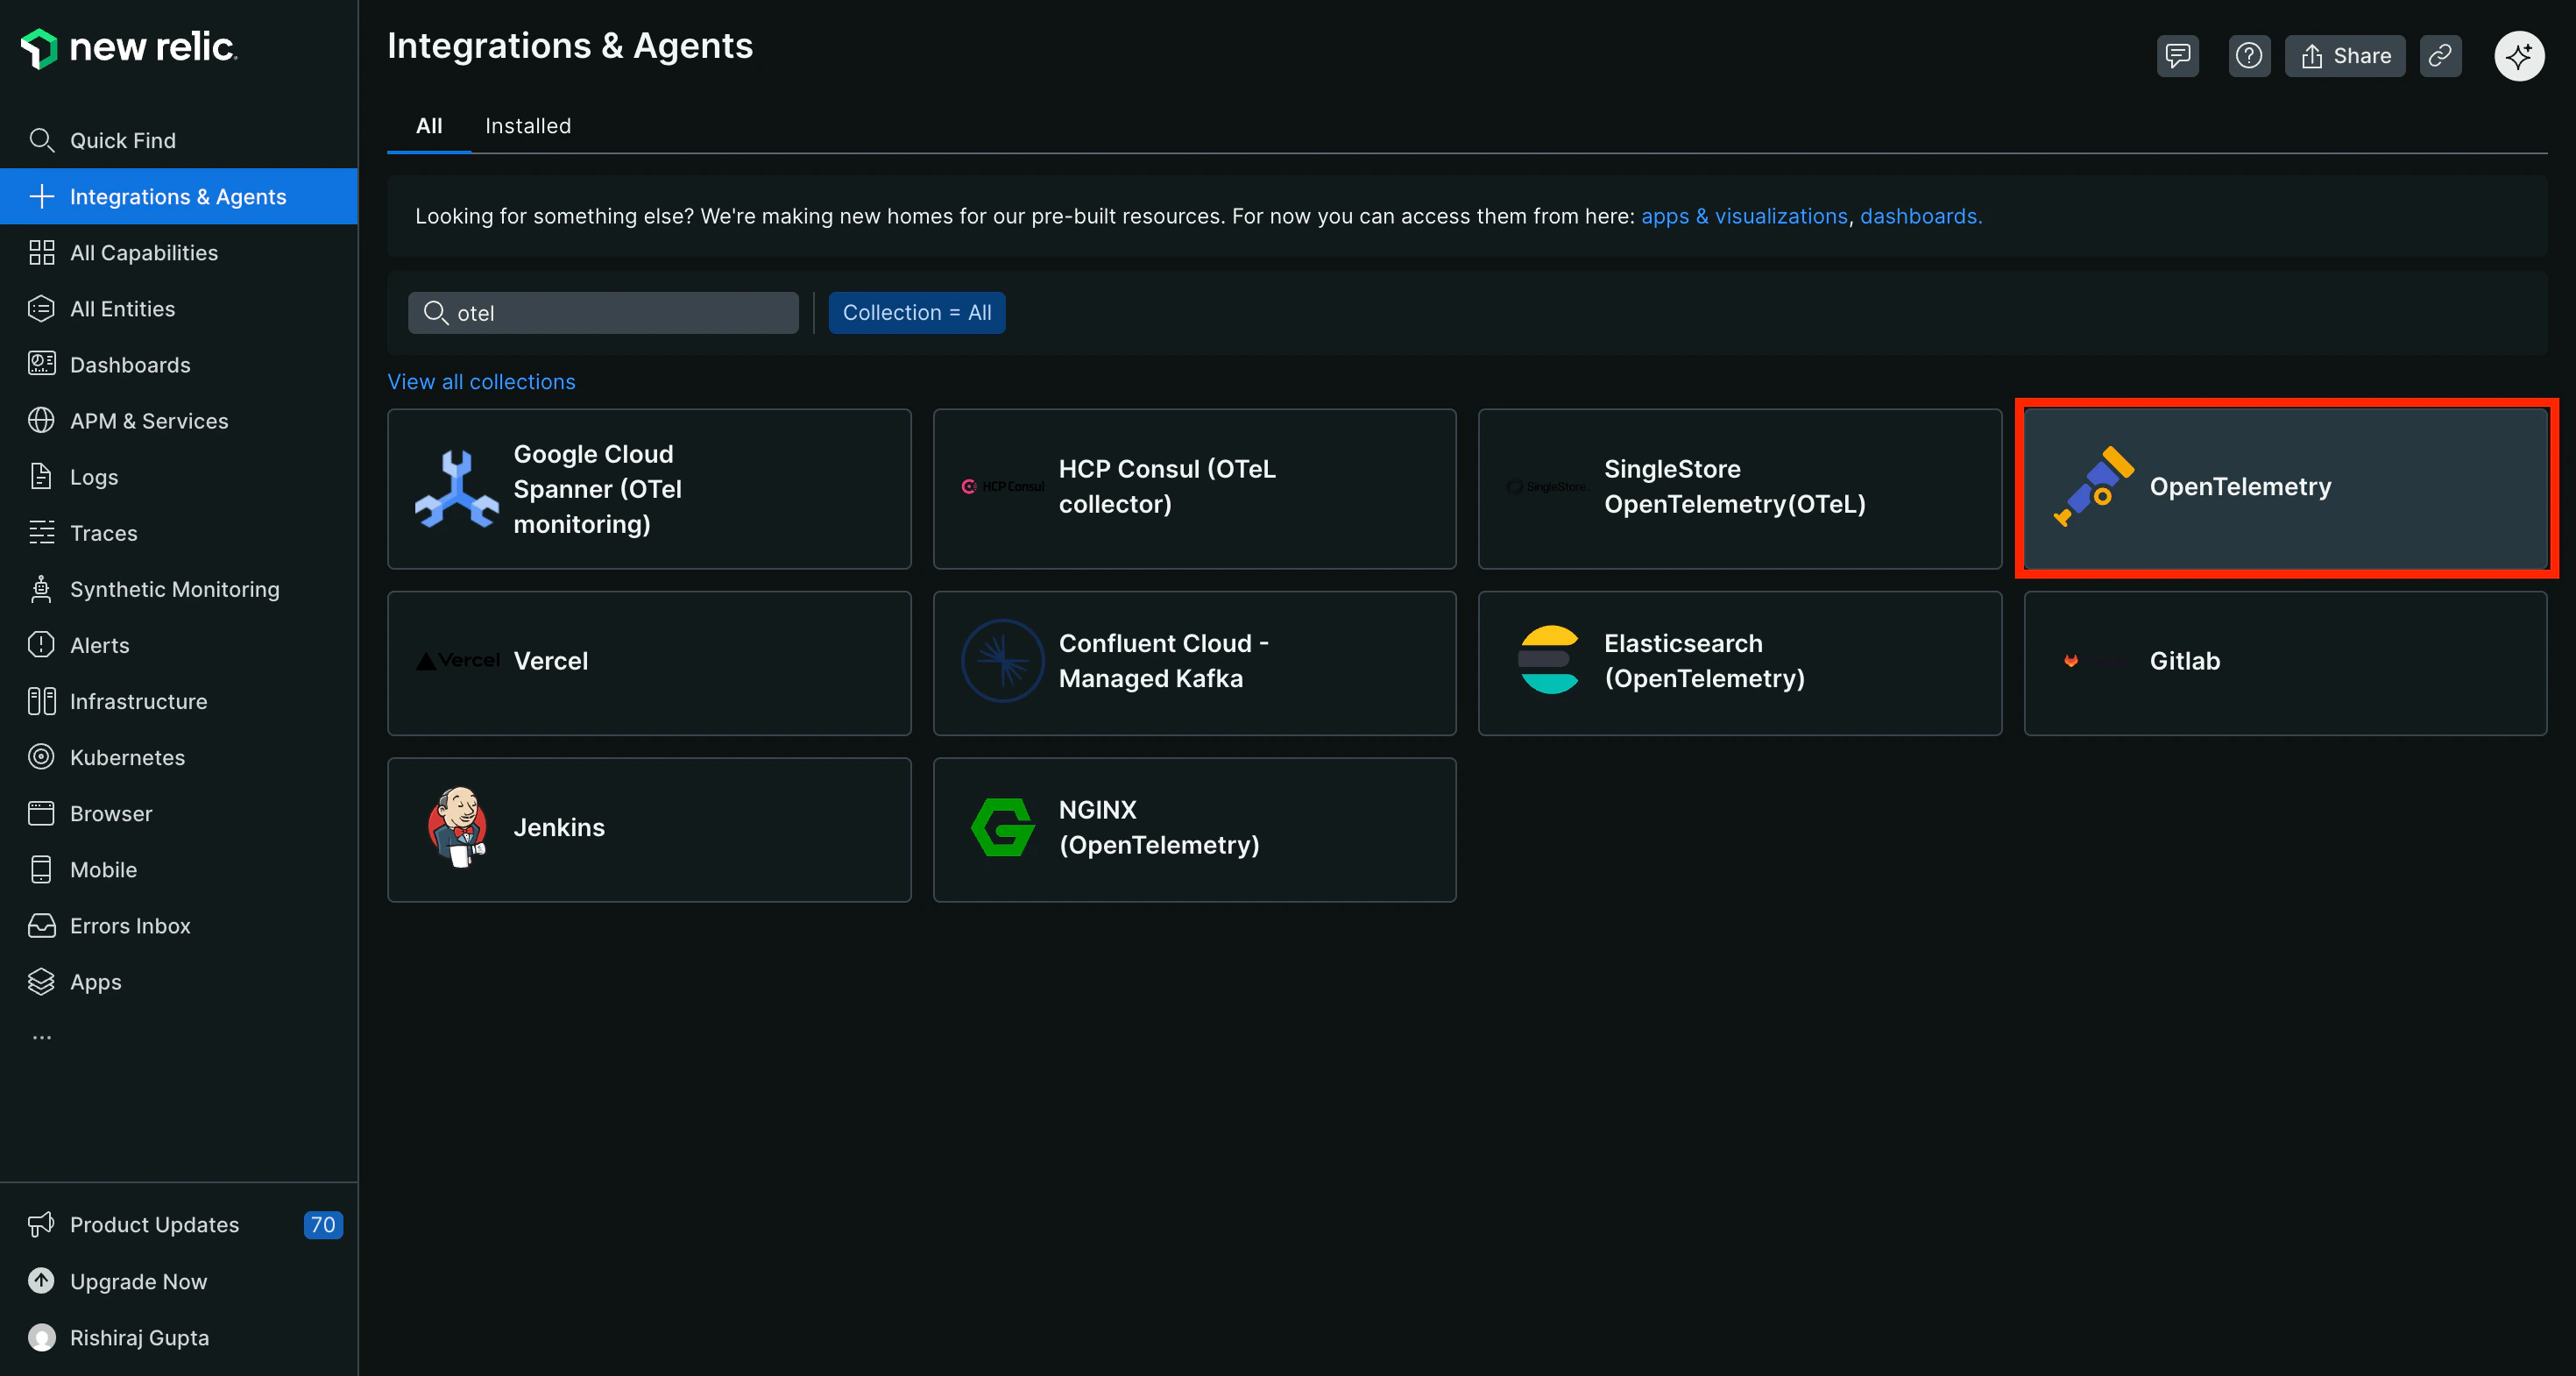
2. Navigate to **Integrations & Agents** in the left sidebar
3. Search for **otel** and select **OpenTelemetry**
 4. In the Installation plan, locate the **Ingest credentials** section on the right
5. Click **Generate and copy license key** to generate your ingest license key
4. In the Installation plan, locate the **Ingest credentials** section on the right
5. Click **Generate and copy license key** to generate your ingest license key
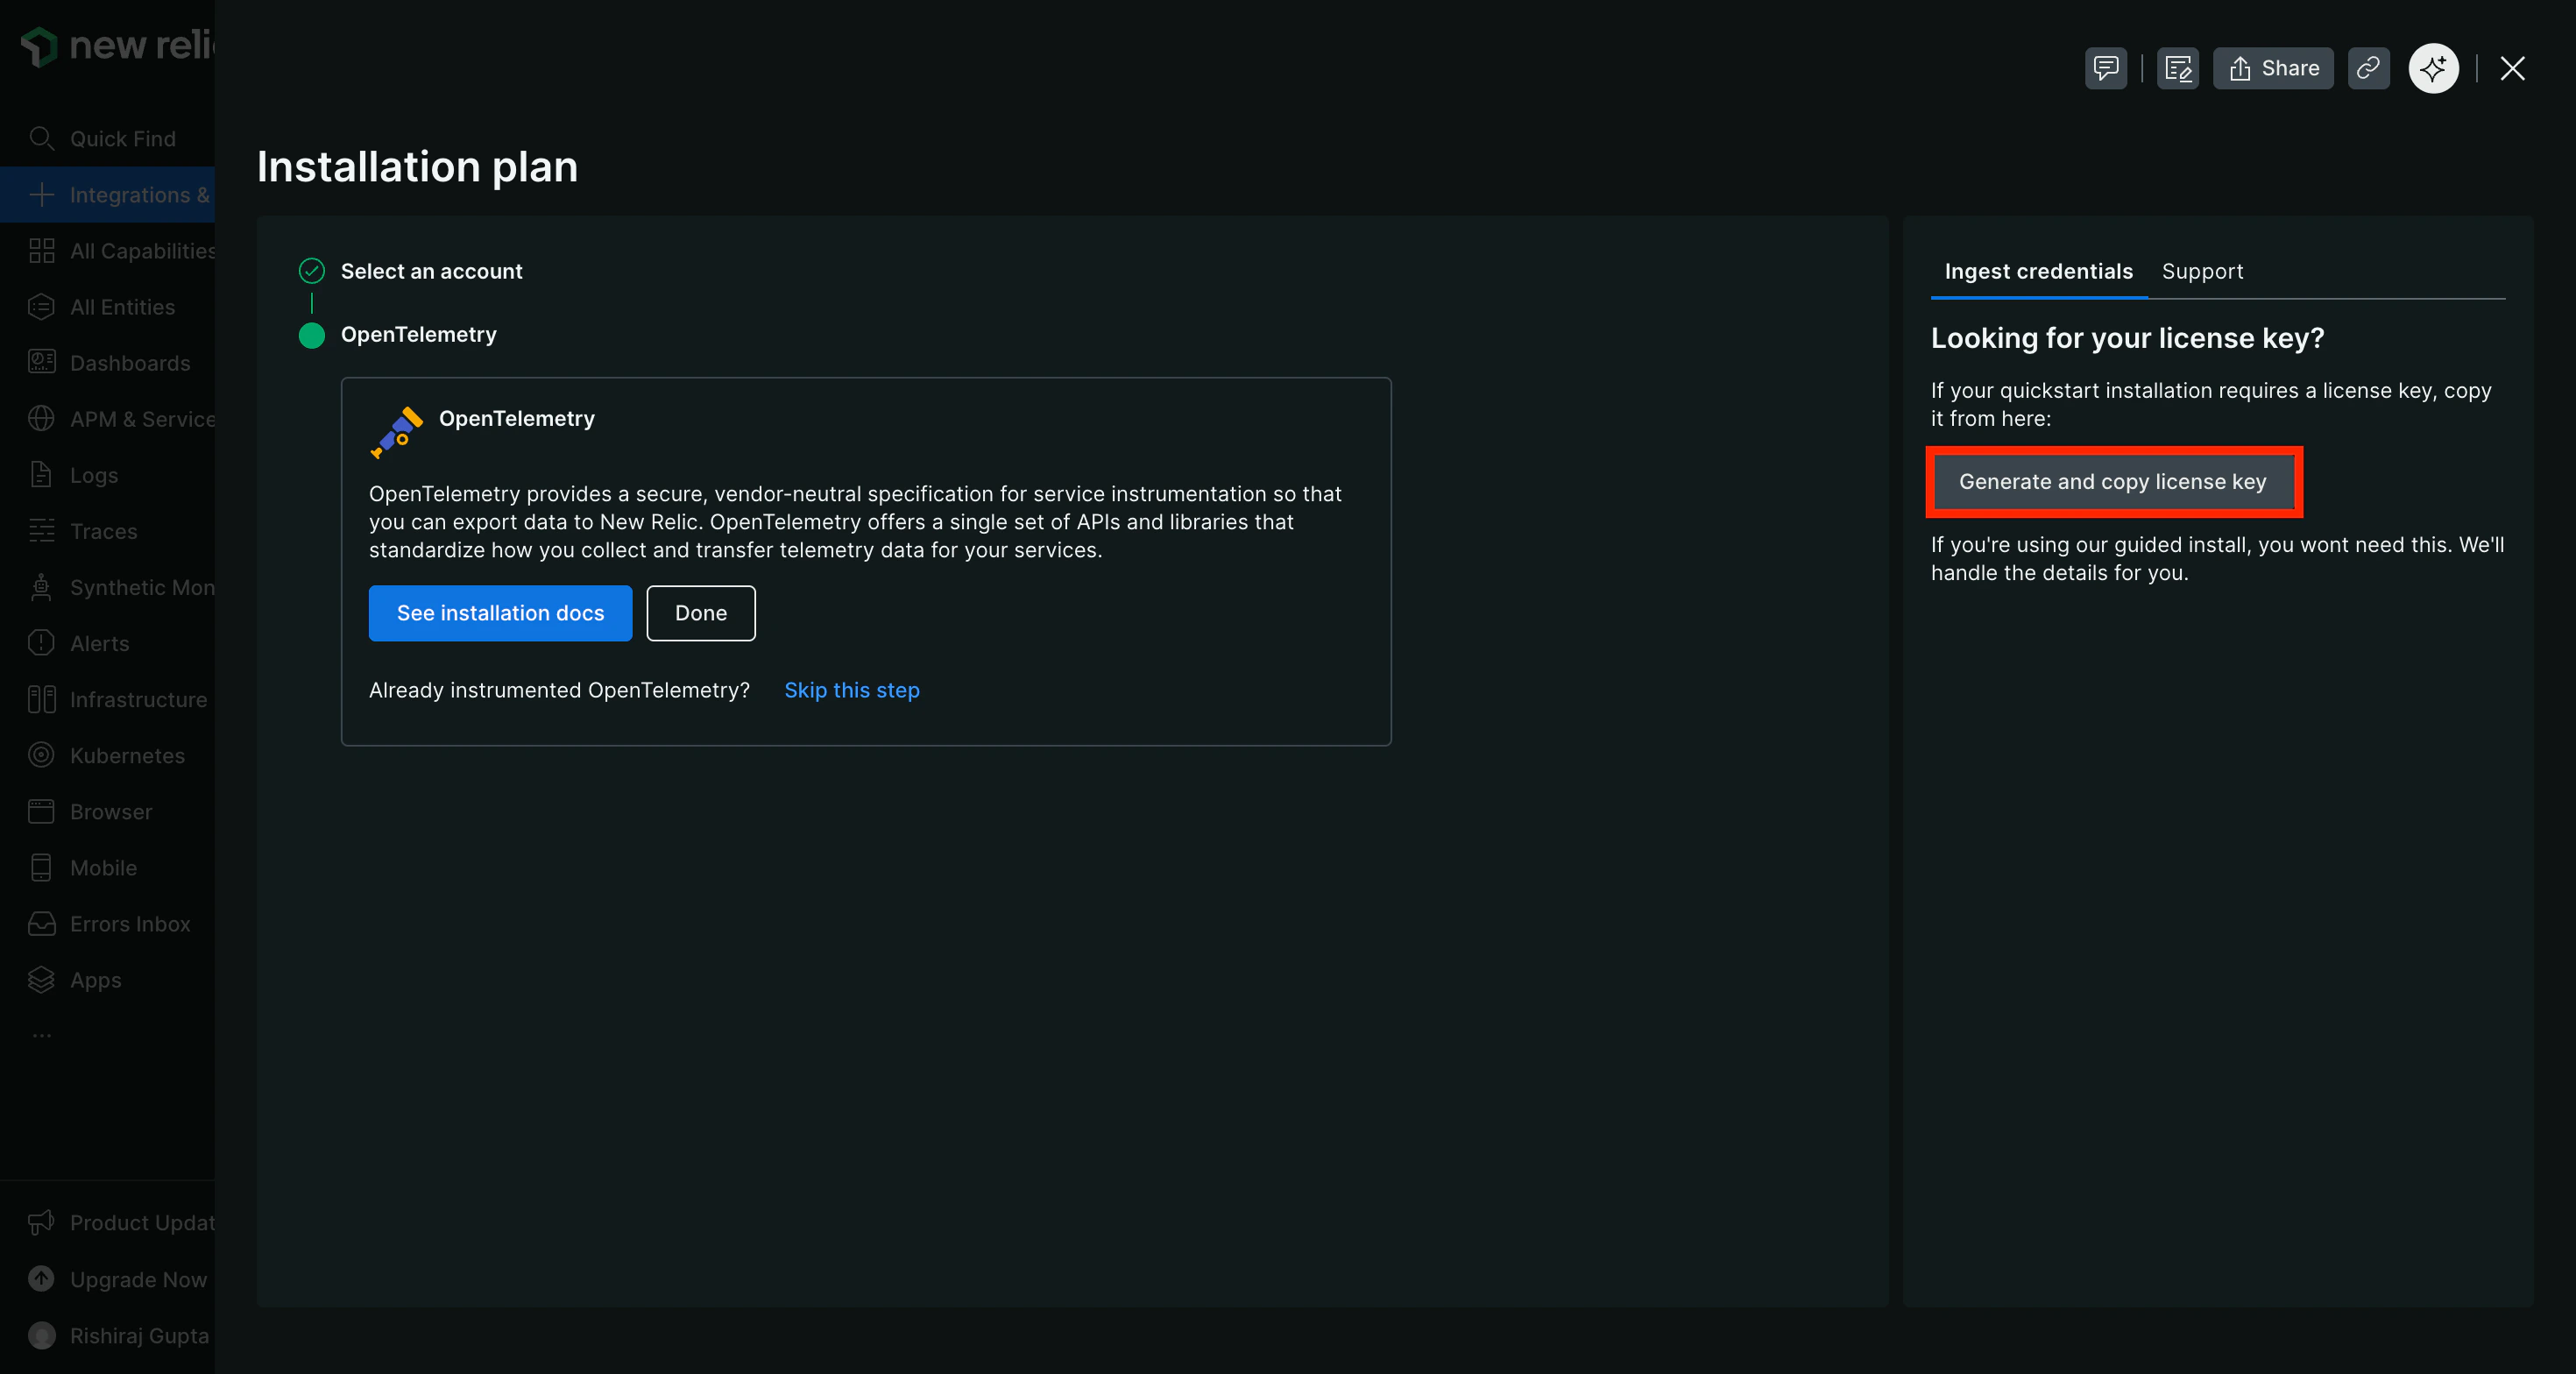 The **Ingest License Key** is different from a regular New Relic API key. You must use the license key generated from the OpenTelemetry integration page for OTLP data ingestion. Regular API keys will not work for sending telemetry data.
### Step 2: Configure OTEL Export in TrueFoundry
Navigate to the TrueFoundry AI Gateway OTEL configuration:
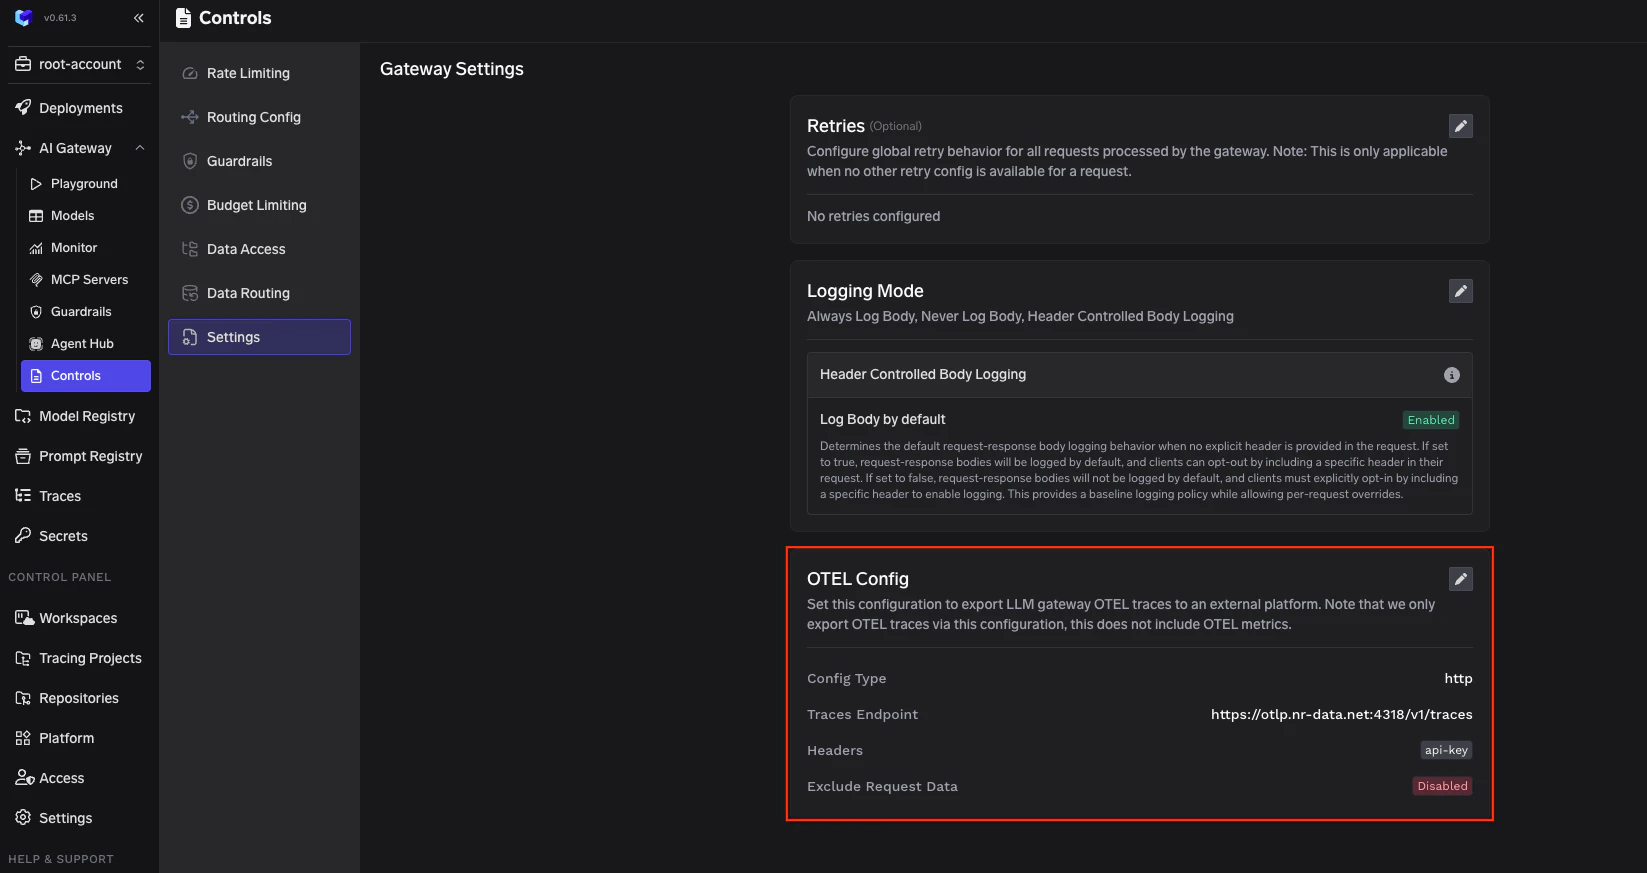
1. Go to **AI Gateway** → **Controls** → **Settings** in the TrueFoundry dashboard
2. Scroll down to the **OTEL Config** section
3. Click the edit button to configure the OTEL exporter
The **Ingest License Key** is different from a regular New Relic API key. You must use the license key generated from the OpenTelemetry integration page for OTLP data ingestion. Regular API keys will not work for sending telemetry data.
### Step 2: Configure OTEL Export in TrueFoundry
Navigate to the TrueFoundry AI Gateway OTEL configuration:
1. Go to **AI Gateway** → **Controls** → **Settings** in the TrueFoundry dashboard
2. Scroll down to the **OTEL Config** section
3. Click the edit button to configure the OTEL exporter
 ### Step 3: Configure New Relic Endpoint
Enable the OTEL Traces Exporter and fill in the following configuration:
| Field | Value |
| ------------------- | ----------------------------------------- |
| **Config Type** | `http` |
| **Traces endpoint** | `https://otlp.nr-data.net:4318/v1/traces` |
| **Encoding** | `Json` |
The endpoint varies based on your New Relic account region. See the [Regional Endpoints](#new-relic-regional-endpoints) section below for the correct endpoint for your region.
### Step 4: Add Required Headers
Click **+ Add Headers** and configure the following HTTP header:
| Header | Value |
| --------- | ----------------------------------------------- |
| `api-key` | Your New Relic Ingest License key (from Step 1) |
### Step 5: Save Configuration
Click **Save** to apply the OTEL export configuration. All LLM traces from the TrueFoundry AI Gateway will now be automatically exported to New Relic.
### Step 6: View Traces in New Relic
After making LLM requests through TrueFoundry AI Gateway, log in to your New Relic dashboard to view the traces:
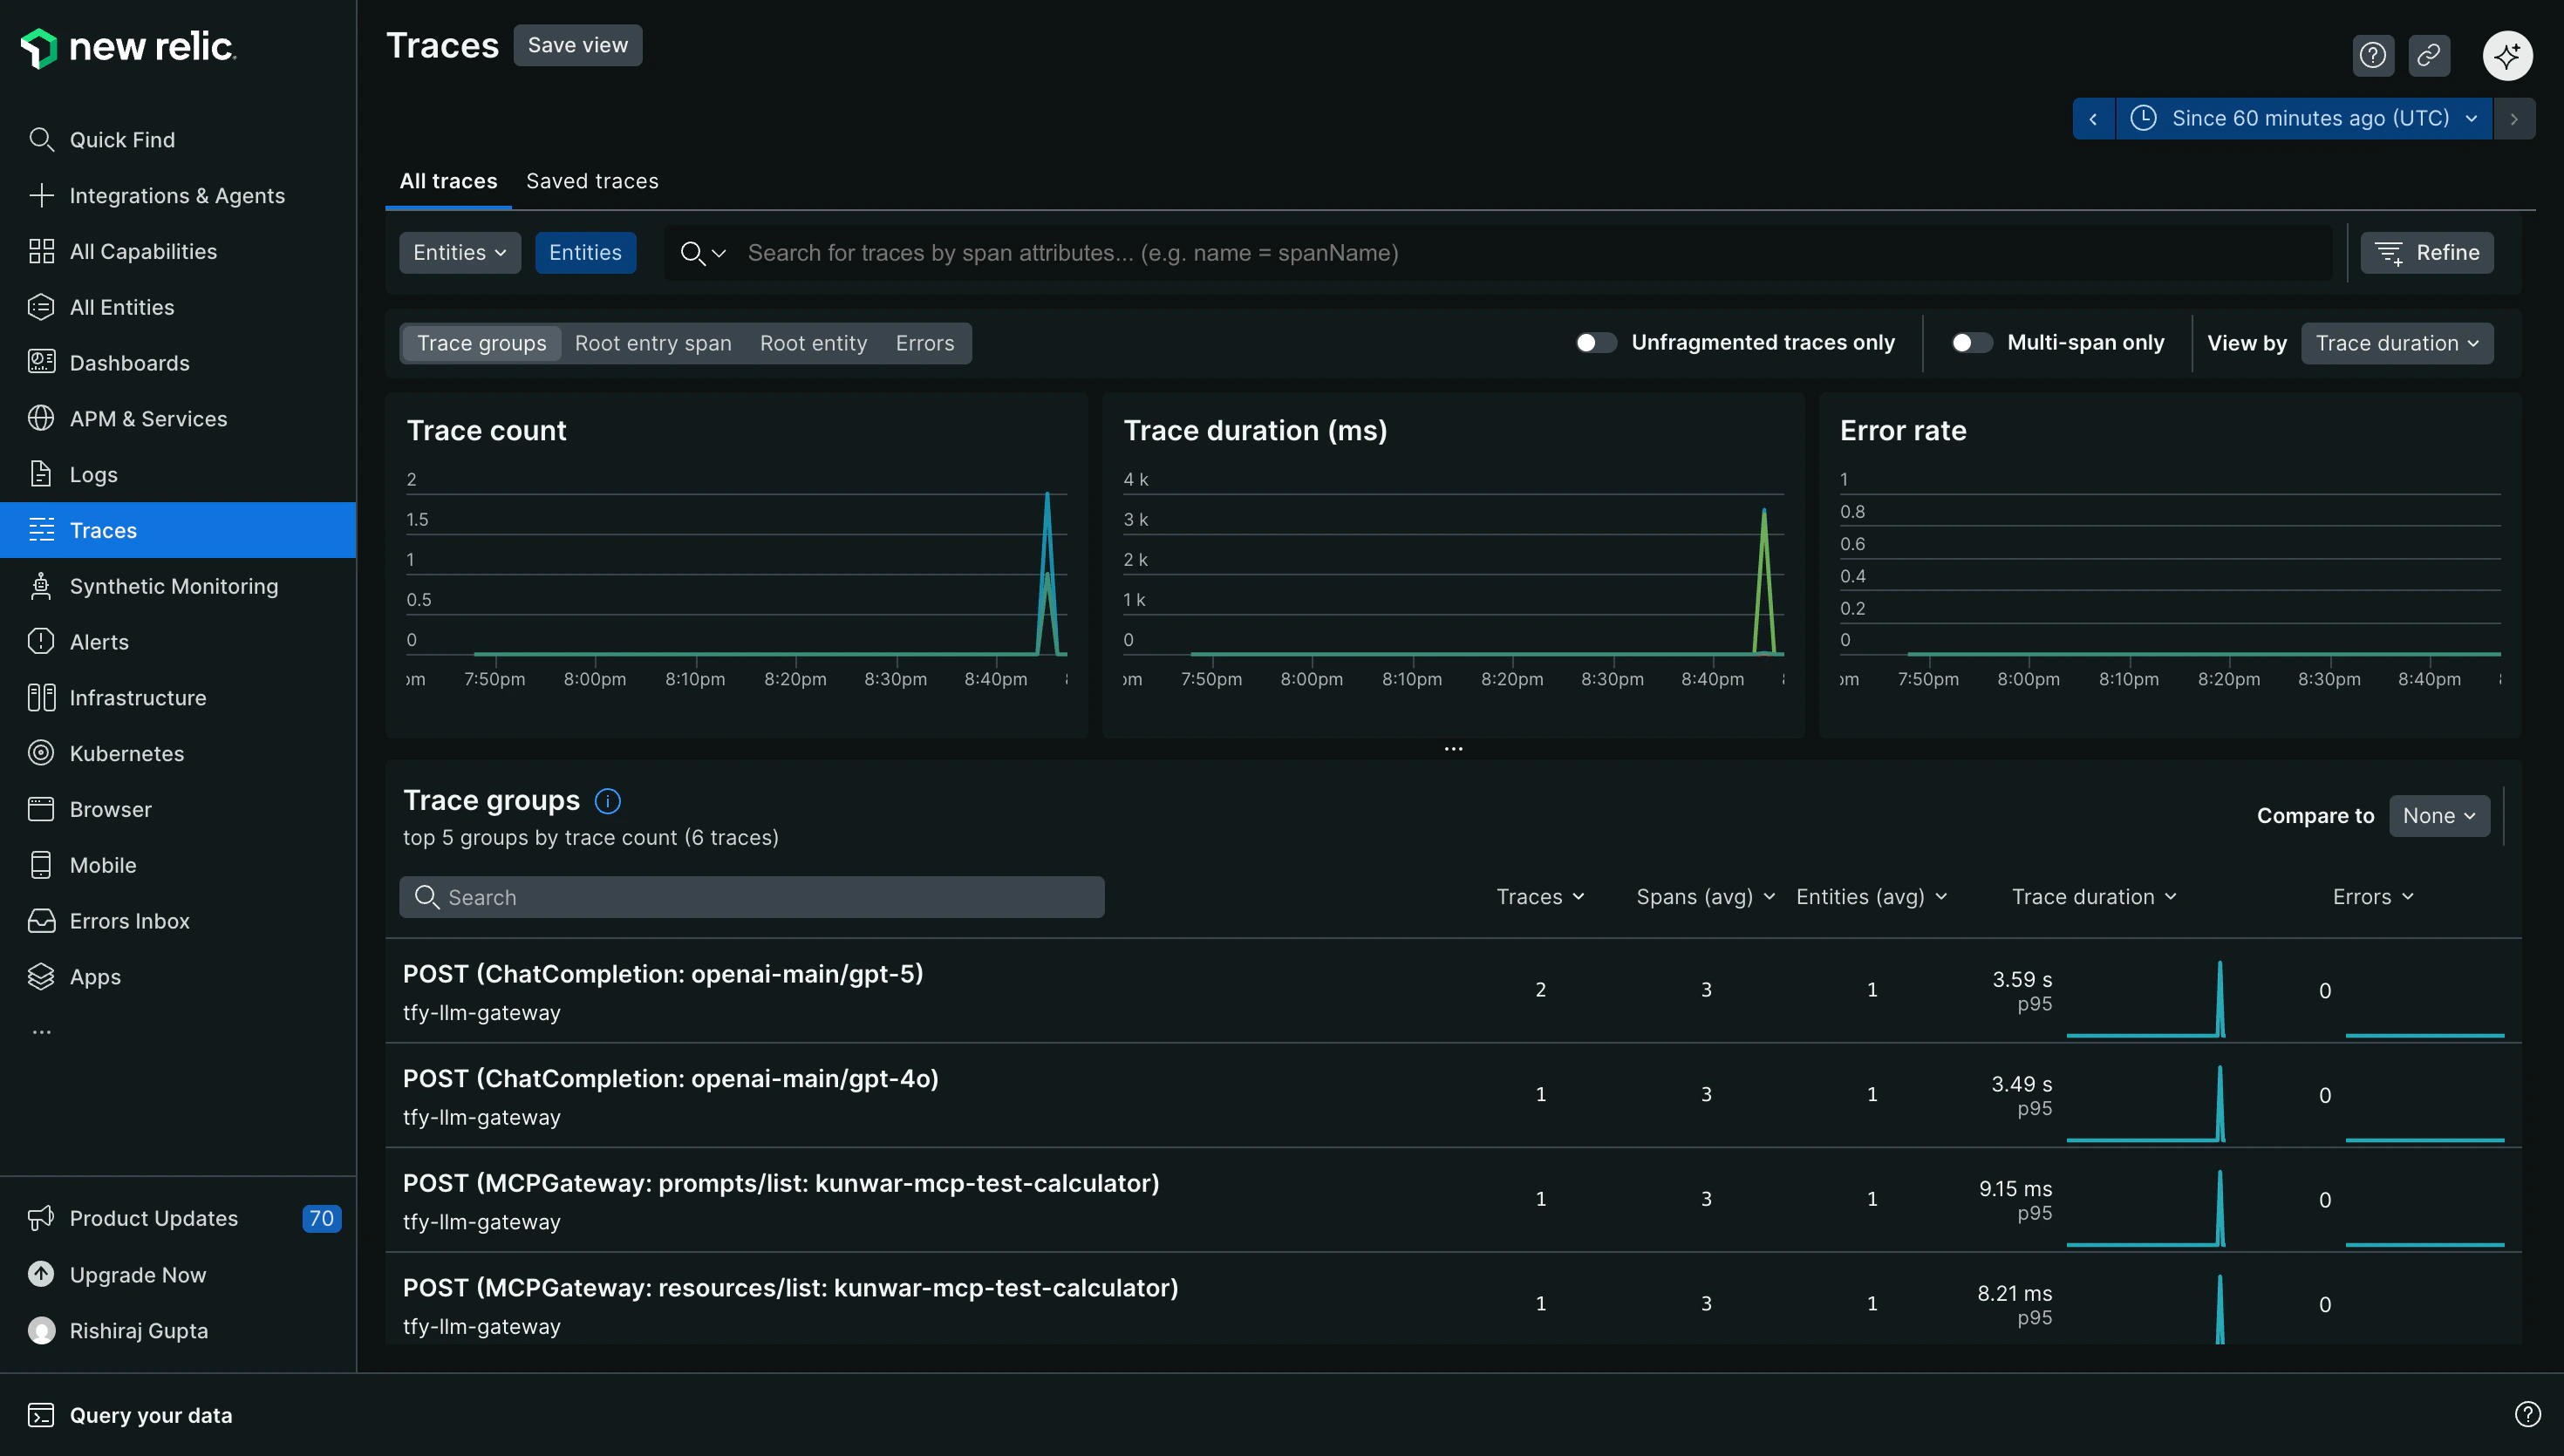
1. Navigate to **Traces** in the left sidebar
2. Look for traces from the `tfy-llm-gateway` service
3. Explore the traces including:
* **Trace Groups**: Grouped traces by operation type (ChatCompletion, MCPGateway, etc.)
* **Trace Duration**: Latency metrics and performance analysis
* **Span Details**: Detailed span data including LLM operations and token usage
### Step 3: Configure New Relic Endpoint
Enable the OTEL Traces Exporter and fill in the following configuration:
| Field | Value |
| ------------------- | ----------------------------------------- |
| **Config Type** | `http` |
| **Traces endpoint** | `https://otlp.nr-data.net:4318/v1/traces` |
| **Encoding** | `Json` |
The endpoint varies based on your New Relic account region. See the [Regional Endpoints](#new-relic-regional-endpoints) section below for the correct endpoint for your region.
### Step 4: Add Required Headers
Click **+ Add Headers** and configure the following HTTP header:
| Header | Value |
| --------- | ----------------------------------------------- |
| `api-key` | Your New Relic Ingest License key (from Step 1) |
### Step 5: Save Configuration
Click **Save** to apply the OTEL export configuration. All LLM traces from the TrueFoundry AI Gateway will now be automatically exported to New Relic.
### Step 6: View Traces in New Relic
After making LLM requests through TrueFoundry AI Gateway, log in to your New Relic dashboard to view the traces:
1. Navigate to **Traces** in the left sidebar
2. Look for traces from the `tfy-llm-gateway` service
3. Explore the traces including:
* **Trace Groups**: Grouped traces by operation type (ChatCompletion, MCPGateway, etc.)
* **Trace Duration**: Latency metrics and performance analysis
* **Span Details**: Detailed span data including LLM operations and token usage
 ## Configuration Options
### New Relic Regional Endpoints
New Relic has different OTLP endpoints based on your account region. For the most up-to-date endpoints, refer to the [official New Relic OTLP documentation](https://docs.newrelic.com/docs/opentelemetry/best-practices/opentelemetry-otlp/#configure-endpoint-port-protocol).
| Region | HTTP Endpoint |
| ------ | ---------------------------------------------- |
| US | `https://otlp.nr-data.net:4318/v1/traces` |
| EU | `https://otlp.eu01.nr-data.net:4318/v1/traces` |
Choose the endpoint that matches your New Relic account region.
### Supported Protocols
New Relic supports both HTTP and gRPC protocols for OTLP ingestion:
| Protocol | Port | Endpoint Format |
| -------- | ---- | ----------------------------------------- |
| HTTP | 4318 | `https://otlp.nr-data.net:4318/v1/traces` |
| gRPC | 4317 | `https://otlp.nr-data.net:4317` |
We recommend using HTTP with JSON encoding for easier debugging and compatibility. For higher throughput scenarios, consider using gRPC with Proto encoding.
### Additional Resource Attributes
You can optionally configure **Additional Resource Attributes** to append custom attributes to every exported trace. This is useful for adding environment-specific metadata or organizational tags that help with filtering and grouping in New Relic.
## Benefits of Using New Relic with TrueFoundry
1. **Unified Observability**: View all your LLM traces alongside other application telemetry in New Relic's comprehensive platform
2. **AI-Powered Analysis**: Leverage New Relic AI to quickly identify anomalies and performance issues in your LLM usage
3. **Custom Dashboards**: Create custom dashboards to visualize LLM performance metrics, token usage, and costs
4. **Alerting**: Set up alerts for latency spikes, error rates, or unusual patterns in your LLM requests
5. **Correlation**: Correlate LLM traces with infrastructure metrics and logs for complete visibility
## Configuration Options
### New Relic Regional Endpoints
New Relic has different OTLP endpoints based on your account region. For the most up-to-date endpoints, refer to the [official New Relic OTLP documentation](https://docs.newrelic.com/docs/opentelemetry/best-practices/opentelemetry-otlp/#configure-endpoint-port-protocol).
| Region | HTTP Endpoint |
| ------ | ---------------------------------------------- |
| US | `https://otlp.nr-data.net:4318/v1/traces` |
| EU | `https://otlp.eu01.nr-data.net:4318/v1/traces` |
Choose the endpoint that matches your New Relic account region.
### Supported Protocols
New Relic supports both HTTP and gRPC protocols for OTLP ingestion:
| Protocol | Port | Endpoint Format |
| -------- | ---- | ----------------------------------------- |
| HTTP | 4318 | `https://otlp.nr-data.net:4318/v1/traces` |
| gRPC | 4317 | `https://otlp.nr-data.net:4317` |
We recommend using HTTP with JSON encoding for easier debugging and compatibility. For higher throughput scenarios, consider using gRPC with Proto encoding.
### Additional Resource Attributes
You can optionally configure **Additional Resource Attributes** to append custom attributes to every exported trace. This is useful for adding environment-specific metadata or organizational tags that help with filtering and grouping in New Relic.
## Benefits of Using New Relic with TrueFoundry
1. **Unified Observability**: View all your LLM traces alongside other application telemetry in New Relic's comprehensive platform
2. **AI-Powered Analysis**: Leverage New Relic AI to quickly identify anomalies and performance issues in your LLM usage
3. **Custom Dashboards**: Create custom dashboards to visualize LLM performance metrics, token usage, and costs
4. **Alerting**: Set up alerts for latency spikes, error rates, or unusual patterns in your LLM requests
5. **Correlation**: Correlate LLM traces with infrastructure metrics and logs for complete visibility