> ## Documentation Index
> Fetch the complete documentation index at: https://www.truefoundry.com/llms.txt
> Use this file to discover all available pages before exploring further.
# Dynatrace
> Learn how to export LLM Gateway traces to Dynatrace using OpenTelemetry OTLP integration.
This guide provides instructions for integrating [Dynatrace](https://www.dynatrace.com/) with the TrueFoundry AI Gateway to export OpenTelemetry traces.
## What is Dynatrace?
Dynatrace is an enterprise observability platform that provides unified monitoring for applications, infrastructure, and user experience. It offers AI-powered analytics, distributed tracing, and real-time insights across your entire stack.
### Key Features of Dynatrace
* **[Distributed Tracing](https://docs.dynatrace.com/docs/observability/traces/)**: End-to-end trace visualization with the Distributed Tracing Explorer
* **[OpenTelemetry Native](https://docs.dynatrace.com/docs/ingest-from/opentelemetry/otlp-api)**: Native OTLP endpoint support for seamless OpenTelemetry data ingestion
* **[AI-Powered Analysis](https://www.dynatrace.com/platform/artificial-intelligence/)**: Automatic anomaly detection and root cause analysis
## Prerequisites
Before integrating Dynatrace with TrueFoundry, ensure you have:
1. **TrueFoundry Account**: Create a [TrueFoundry account](https://www.truefoundry.com/register) and follow the instructions in our [Gateway Quick Start Guide](https://docs.truefoundry.com/docs/ai-gateway/quick-start)
2. **Dynatrace Account**: Sign up for a [Dynatrace account](https://www.dynatrace.com/trial/)
3. **Environment ID**: Your Dynatrace environment ID (e.g., `xpk75638` from `https://xpk75638.live.dynatrace.com`)
4. **API Access Token**: Create an access token with the `openTelemetryTrace.ingest` scope in Dynatrace
## Integration Guide
TrueFoundry AI Gateway supports exporting OpenTelemetry (OTEL) traces to Dynatrace via OTLP. This allows you to view your LLM Gateway traces in Dynatrace's Distributed Tracing Explorer alongside your other application telemetry.
### Step 1: Get Your Dynatrace OTLP Endpoint and API Token
1. Log in to your [Dynatrace environment](https://www.dynatrace.com/)
2. Find your **Environment ID** from the browser address bar (e.g., `xpk75638`). Do **not** include `.apps` in the URL.
3. **Create an API access token**:
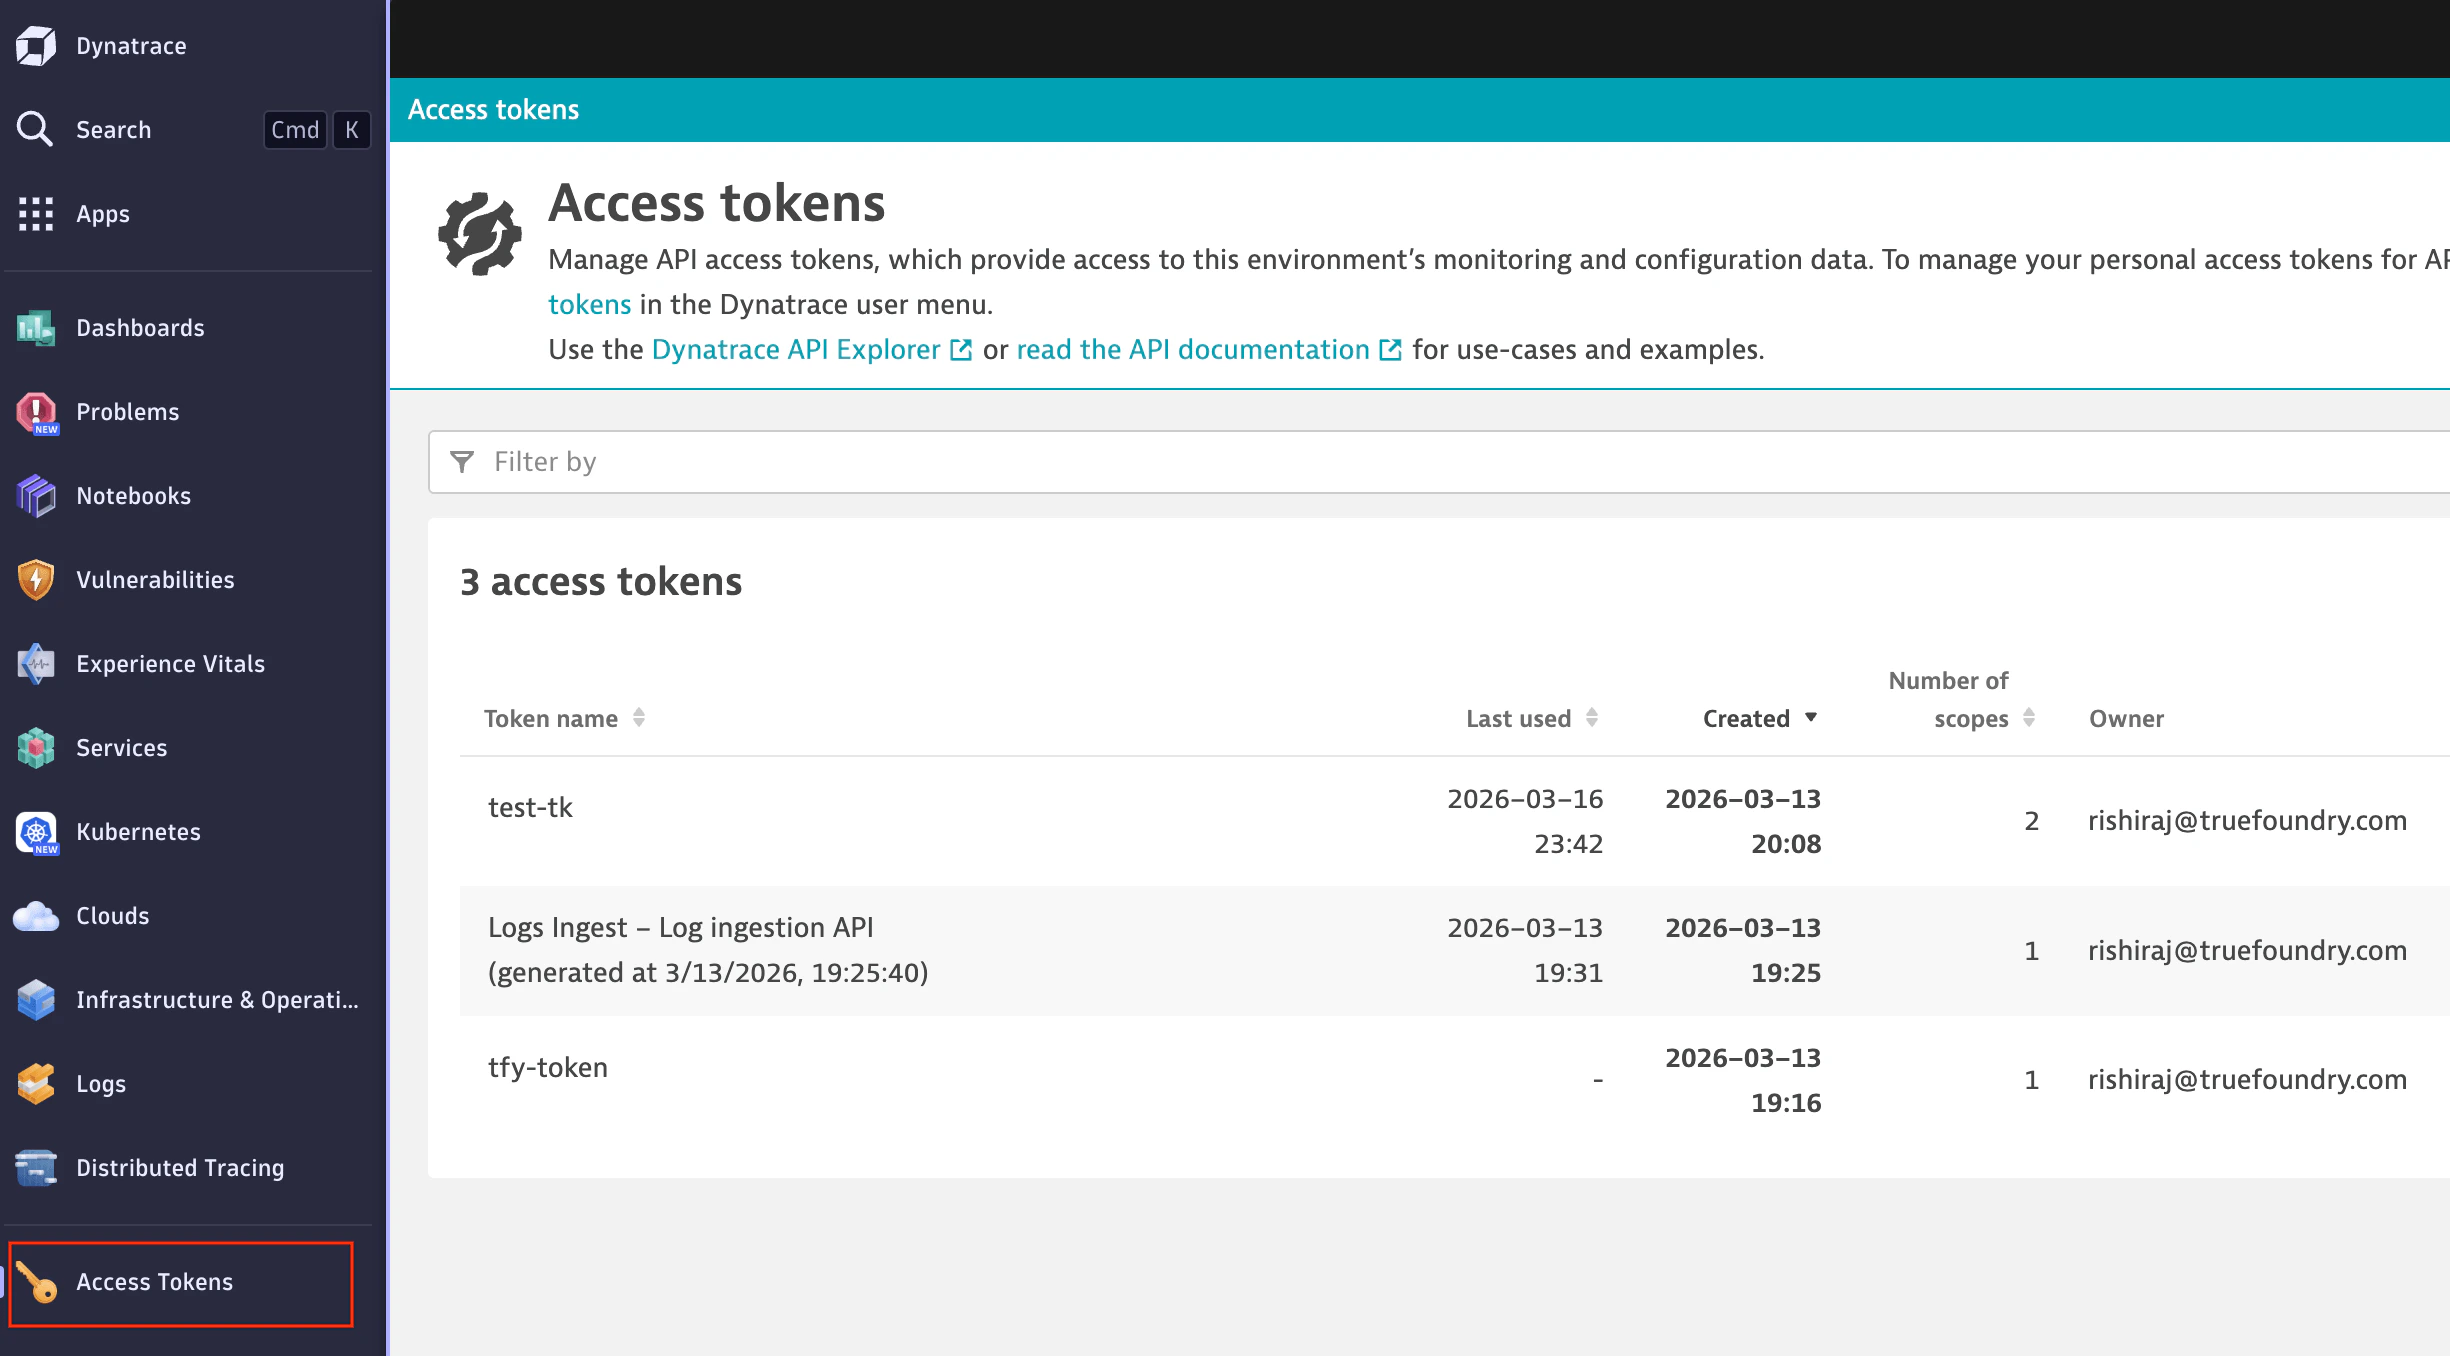
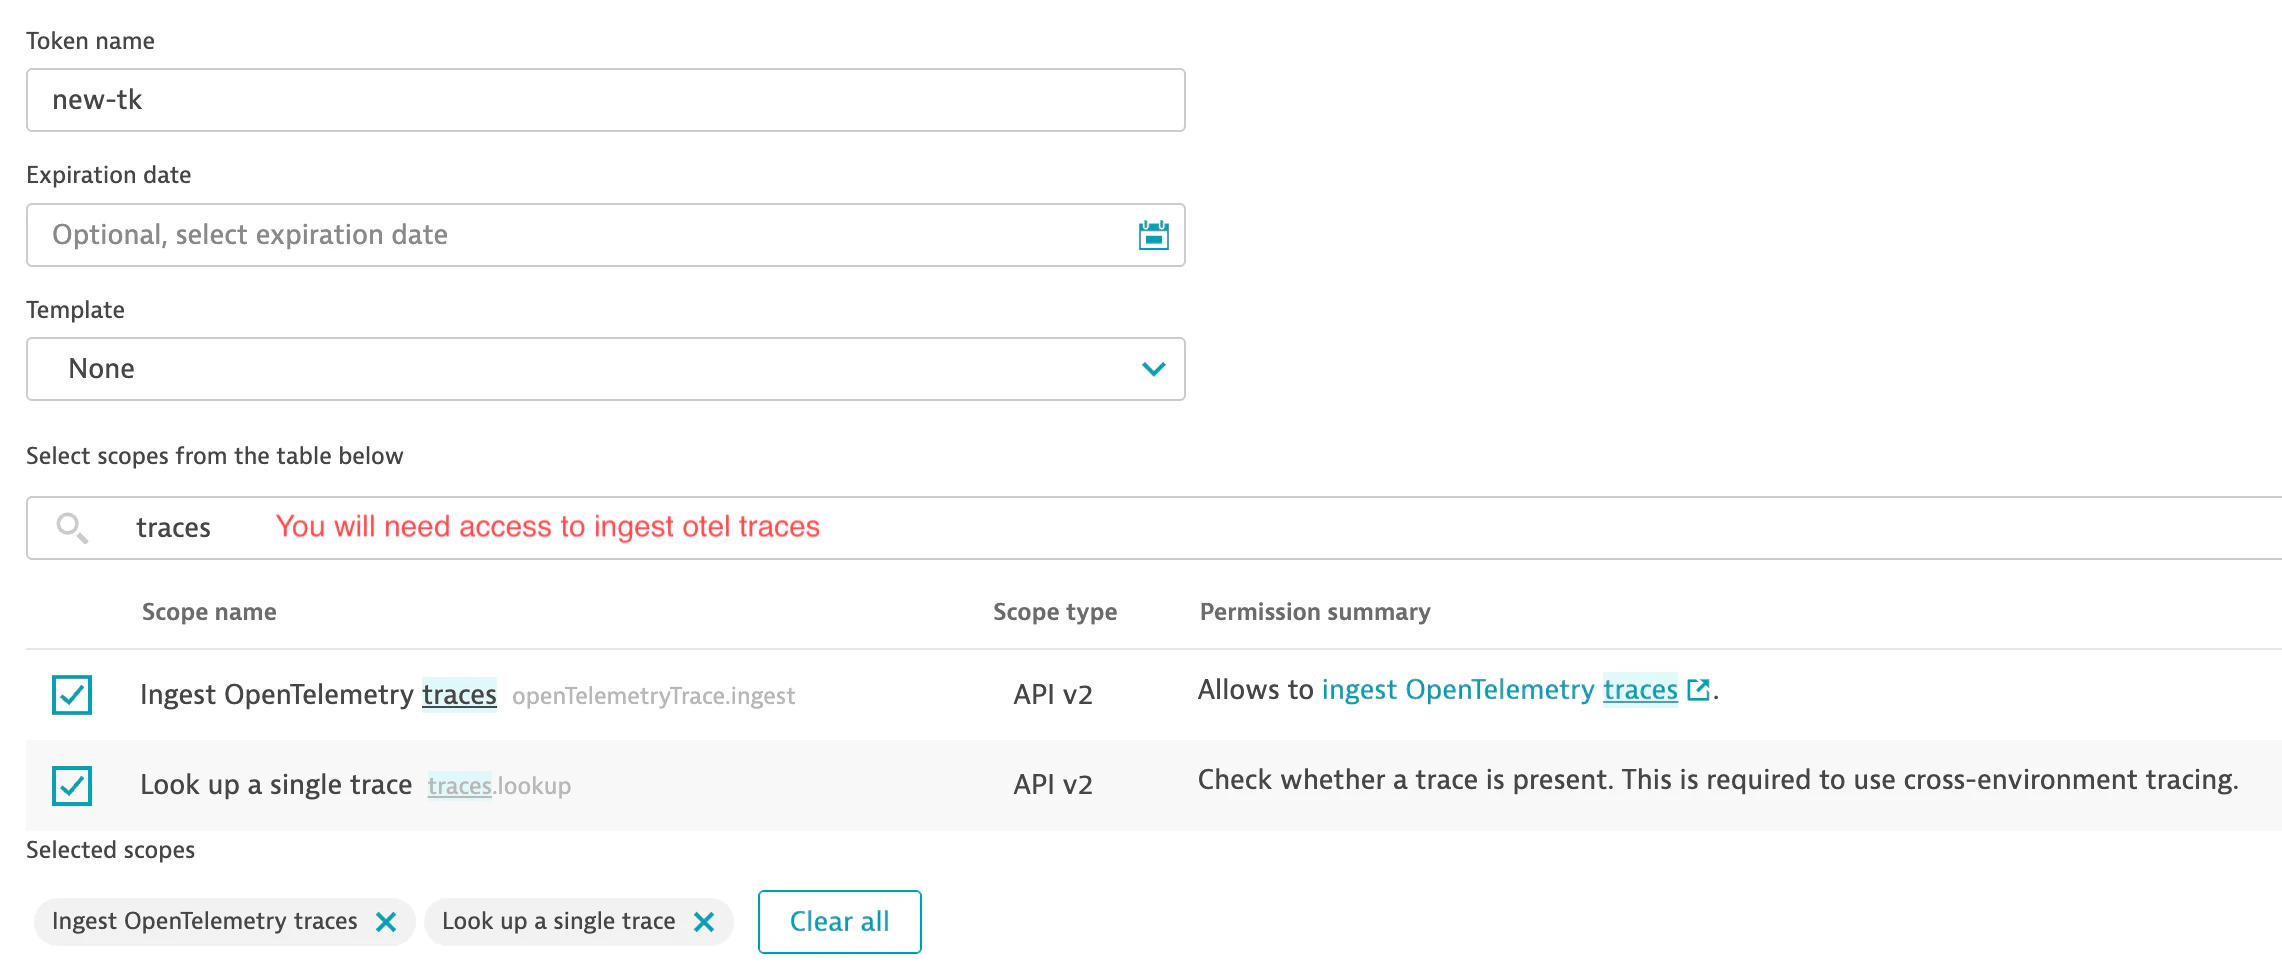 * Copy the token value (it starts with `dt0c01.`)
The correct base URL format is `https://{your-environment-id}.live.dynatrace.com/api/v2/otlp`. If you copy your environment ID from the browser, ensure you use `live.dynatrace.com` and **not** `live.apps.dynatrace.com`—otherwise the API will return 404 errors.
For more details, see the [Dynatrace OTLP API documentation](https://docs.dynatrace.com/docs/ingest-from/opentelemetry/otlp-api).
### Step 2: Configure OTEL Export in TrueFoundry
Navigate to the TrueFoundry AI Gateway OTEL configuration:
1. Go to **AI Gateway** > **Controls** > **Settings** in the TrueFoundry dashboard
2. Scroll down to the **OTEL Config** section
3. Click the edit button to configure the OTEL exporter
* Copy the token value (it starts with `dt0c01.`)
The correct base URL format is `https://{your-environment-id}.live.dynatrace.com/api/v2/otlp`. If you copy your environment ID from the browser, ensure you use `live.dynatrace.com` and **not** `live.apps.dynatrace.com`—otherwise the API will return 404 errors.
For more details, see the [Dynatrace OTLP API documentation](https://docs.dynatrace.com/docs/ingest-from/opentelemetry/otlp-api).
### Step 2: Configure OTEL Export in TrueFoundry
Navigate to the TrueFoundry AI Gateway OTEL configuration:
1. Go to **AI Gateway** > **Controls** > **Settings** in the TrueFoundry dashboard
2. Scroll down to the **OTEL Config** section
3. Click the edit button to configure the OTEL exporter
 ### Step 3: Configure Dynatrace Endpoint
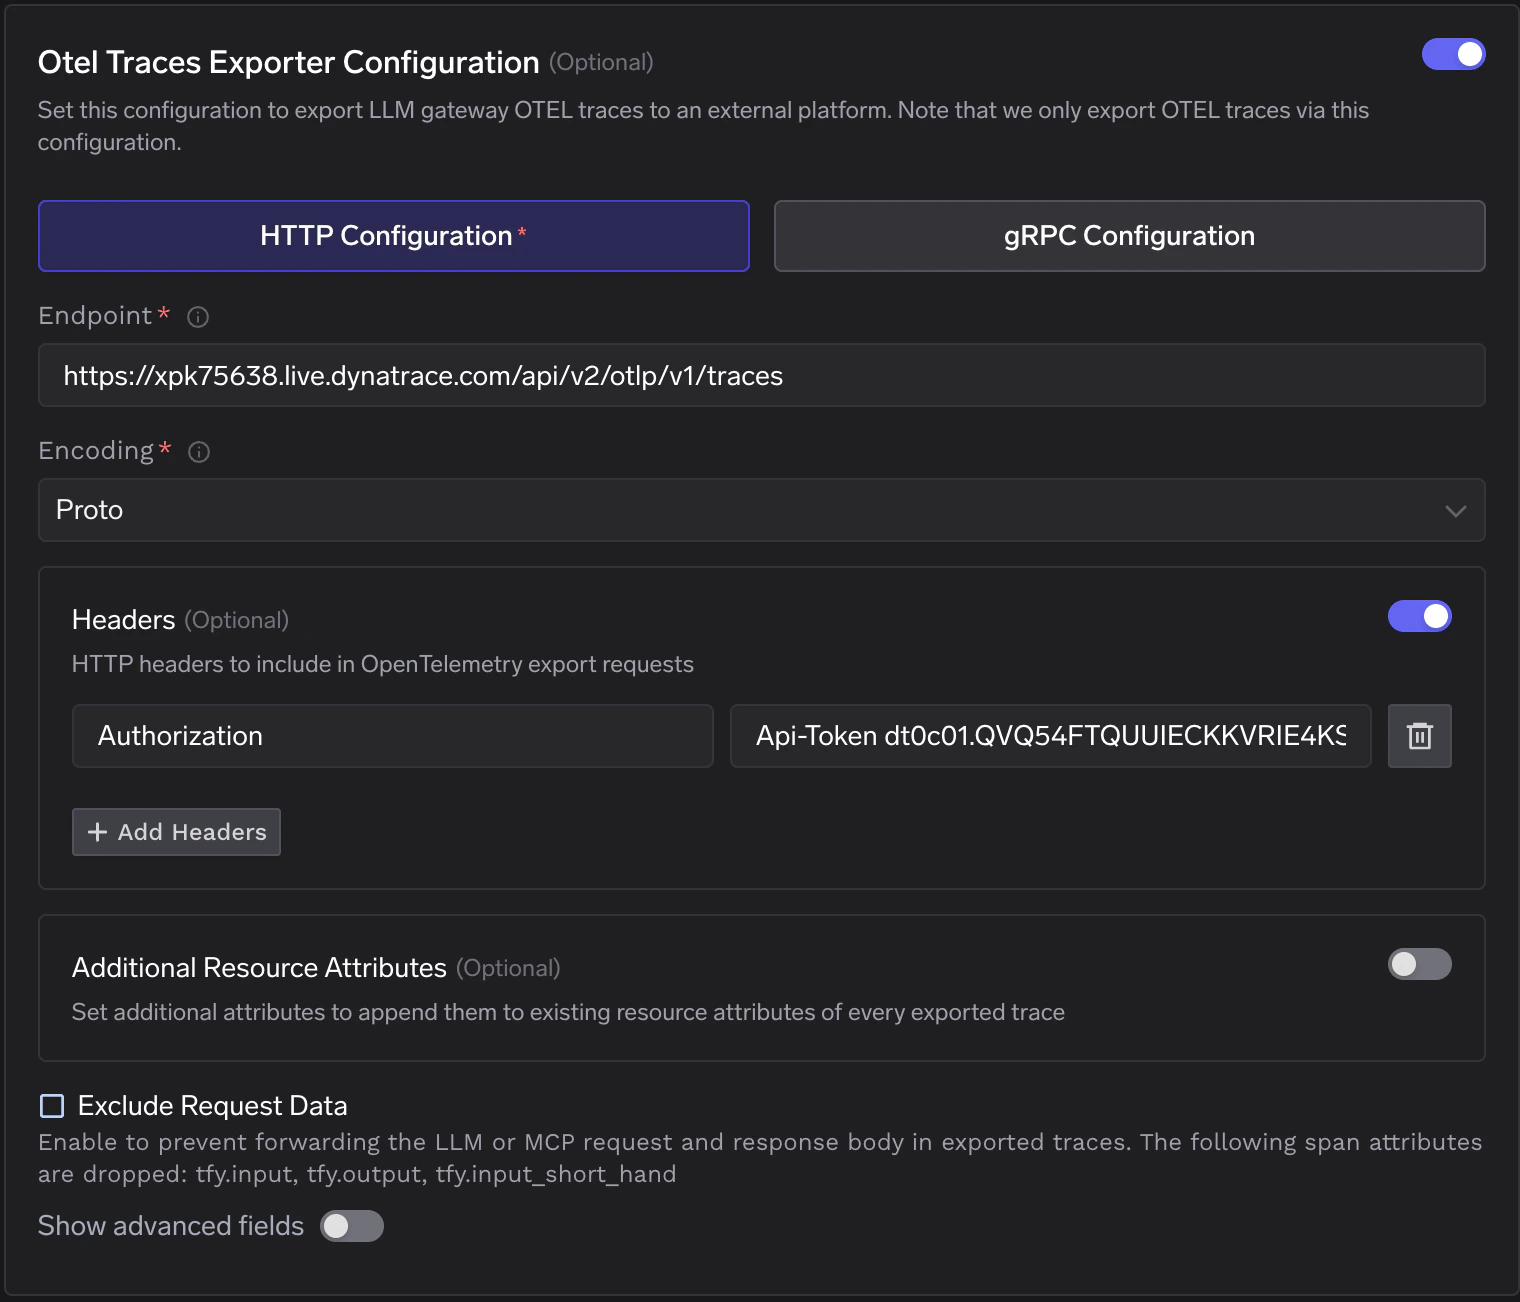
Enable the **OTEL Traces Exporter Configuration** toggle and fill in the following:
| Field | Value |
| --------------- | ------------------------------------------------------------------------ |
| **Config Type** | `HTTP Configuration` |
| **Endpoint** | `https://{your-environment-id}.live.dynatrace.com/api/v2/otlp/v1/traces` |
| **Encoding** | `Proto` |
Dynatrace **requires** binary format (Protocol Buffers). JSON encoding is **not supported**. Use the `Proto` encoding option.
Replace `{your-environment-id}` with your Dynatrace environment ID (e.g., `xpk75638`). Do not include `.apps` in the domain.
### Step 4: Add Required Headers
Click **+ Add Headers** and configure the following HTTP header:
| Header | Value |
| --------------- | ------------------------ |
| `Authorization` | `Api-Token {your-token}` |
Use the exact format `Api-Token {your-token}`. The `Api-Token` prefix is required for Dynatrace authentication—a regular Bearer token will not work.
### Step 5: Save Configuration
Click **Save** to apply the OTEL export configuration. All LLM traces from the TrueFoundry AI Gateway will now be automatically exported to Dynatrace.
### Step 6: View Traces in Dynatrace
After making LLM requests through TrueFoundry AI Gateway, view the traces in Dynatrace:
1. Navigate to **Distributed Tracing** > **Explorer** in the Dynatrace sidebar
2. Filter by service: **`tfy-llm-gateway`** to see your LLM Gateway traces
3. Explore the traces including:
* **Request timeseries**: Success/failure counts and duration percentiles
* **Request list**: Individual requests with endpoint, duration, and HTTP status
* **Span details**: Full trace breakdown by request
### Step 3: Configure Dynatrace Endpoint
Enable the **OTEL Traces Exporter Configuration** toggle and fill in the following:
| Field | Value |
| --------------- | ------------------------------------------------------------------------ |
| **Config Type** | `HTTP Configuration` |
| **Endpoint** | `https://{your-environment-id}.live.dynatrace.com/api/v2/otlp/v1/traces` |
| **Encoding** | `Proto` |
Dynatrace **requires** binary format (Protocol Buffers). JSON encoding is **not supported**. Use the `Proto` encoding option.
Replace `{your-environment-id}` with your Dynatrace environment ID (e.g., `xpk75638`). Do not include `.apps` in the domain.
### Step 4: Add Required Headers
Click **+ Add Headers** and configure the following HTTP header:
| Header | Value |
| --------------- | ------------------------ |
| `Authorization` | `Api-Token {your-token}` |
Use the exact format `Api-Token {your-token}`. The `Api-Token` prefix is required for Dynatrace authentication—a regular Bearer token will not work.
### Step 5: Save Configuration
Click **Save** to apply the OTEL export configuration. All LLM traces from the TrueFoundry AI Gateway will now be automatically exported to Dynatrace.
### Step 6: View Traces in Dynatrace
After making LLM requests through TrueFoundry AI Gateway, view the traces in Dynatrace:
1. Navigate to **Distributed Tracing** > **Explorer** in the Dynatrace sidebar
2. Filter by service: **`tfy-llm-gateway`** to see your LLM Gateway traces
3. Explore the traces including:
* **Request timeseries**: Success/failure counts and duration percentiles
* **Request list**: Individual requests with endpoint, duration, and HTTP status
* **Span details**: Full trace breakdown by request
.png?fit=max&auto=format&n=tbgCTBKbI9eBKDGU&q=85&s=5eeee886fe92149ca83f4754b7516c73) ## Configuration Options
### Using ActiveGate
If you use Dynatrace ActiveGate instead of SaaS:
| Environment Type | Base URL |
| ---------------------------- | --------------------------------------------------------------------------- |
| **Environment ActiveGate** | `https://{your-activegate-domain}:9999/e/{your-environment-id}/api/v2/otlp` |
| **Containerized ActiveGate** | `https://{your-activegate-domain}/e/{your-environment-id}/api/v2/otlp` |
Append `/v1/traces` to the base URL for the full traces endpoint. See [Dynatrace OTLP API documentation](https://docs.dynatrace.com/docs/ingest-from/opentelemetry/otlp-api) for details.
### Additional Resource Attributes
You can optionally configure **Additional Resource Attributes** to append custom attributes to every exported trace. This is useful for adding environment-specific metadata or organizational tags that help with filtering and grouping in Dynatrace.
### Exclude Request Data
Enable **Exclude Request Data** if you want to prevent sending LLM or MCP request/response bodies in exported traces. This drops the `tfy.input`, `tfy.output`, and `tfy.input_short_hand` span attributes.
## API Limitations
Per [Dynatrace OTLP API documentation](https://docs.dynatrace.com/docs/ingest-from/opentelemetry/otlp-api):
* **gRPC is not supported**—use HTTP Configuration only
* **JSON is not supported**—use Proto encoding only
## Troubleshooting
#### 404 Not Found
If you see `HTTP Status Code 404`, verify your endpoint URL. Ensure you are using `live.dynatrace.com` and **not** `live.apps.dynatrace.com`. Remove `.apps` from the domain if copied from the browser address bar.
#### Authentication Failed
Ensure your Authorization header uses the format `Api-Token {your-token}` with the `Api-Token` prefix. The token must have the `openTelemetryTrace.ingest` scope.
#### Traces Not Appearing
Allow a few minutes for traces to appear in Dynatrace. Ensure you have made requests through the TrueFoundry AI Gateway after saving the configuration. Filter by service name `tfy-llm-gateway` in the Distributed Tracing Explorer.
## Configuration Options
### Using ActiveGate
If you use Dynatrace ActiveGate instead of SaaS:
| Environment Type | Base URL |
| ---------------------------- | --------------------------------------------------------------------------- |
| **Environment ActiveGate** | `https://{your-activegate-domain}:9999/e/{your-environment-id}/api/v2/otlp` |
| **Containerized ActiveGate** | `https://{your-activegate-domain}/e/{your-environment-id}/api/v2/otlp` |
Append `/v1/traces` to the base URL for the full traces endpoint. See [Dynatrace OTLP API documentation](https://docs.dynatrace.com/docs/ingest-from/opentelemetry/otlp-api) for details.
### Additional Resource Attributes
You can optionally configure **Additional Resource Attributes** to append custom attributes to every exported trace. This is useful for adding environment-specific metadata or organizational tags that help with filtering and grouping in Dynatrace.
### Exclude Request Data
Enable **Exclude Request Data** if you want to prevent sending LLM or MCP request/response bodies in exported traces. This drops the `tfy.input`, `tfy.output`, and `tfy.input_short_hand` span attributes.
## API Limitations
Per [Dynatrace OTLP API documentation](https://docs.dynatrace.com/docs/ingest-from/opentelemetry/otlp-api):
* **gRPC is not supported**—use HTTP Configuration only
* **JSON is not supported**—use Proto encoding only
## Troubleshooting
#### 404 Not Found
If you see `HTTP Status Code 404`, verify your endpoint URL. Ensure you are using `live.dynatrace.com` and **not** `live.apps.dynatrace.com`. Remove `.apps` from the domain if copied from the browser address bar.
#### Authentication Failed
Ensure your Authorization header uses the format `Api-Token {your-token}` with the `Api-Token` prefix. The token must have the `openTelemetryTrace.ingest` scope.
#### Traces Not Appearing
Allow a few minutes for traces to appear in Dynatrace. Ensure you have made requests through the TrueFoundry AI Gateway after saving the configuration. Filter by service name `tfy-llm-gateway` in the Distributed Tracing Explorer.